
Views on legalizing marijuana differ by race and ethnicity, age, partisanship
% who say marijuana should be …
* Estimates for Asian adults are representative of English speakers only.
Note: White, Black and Asian adults include those who report being only one race and are not Hispanic; Hispanics are of any race. Shares of respondents who did not answer are not shown.
Note: White, Black and Asian adults include those who report being only one race and are not Hispanic; Hispanics are of any race. Shares of respondents who did not answer are not shown.
Source: Survey of U.S. adults conducted Jan. 20-26, 2026.
PEW RESEARCH CENTER
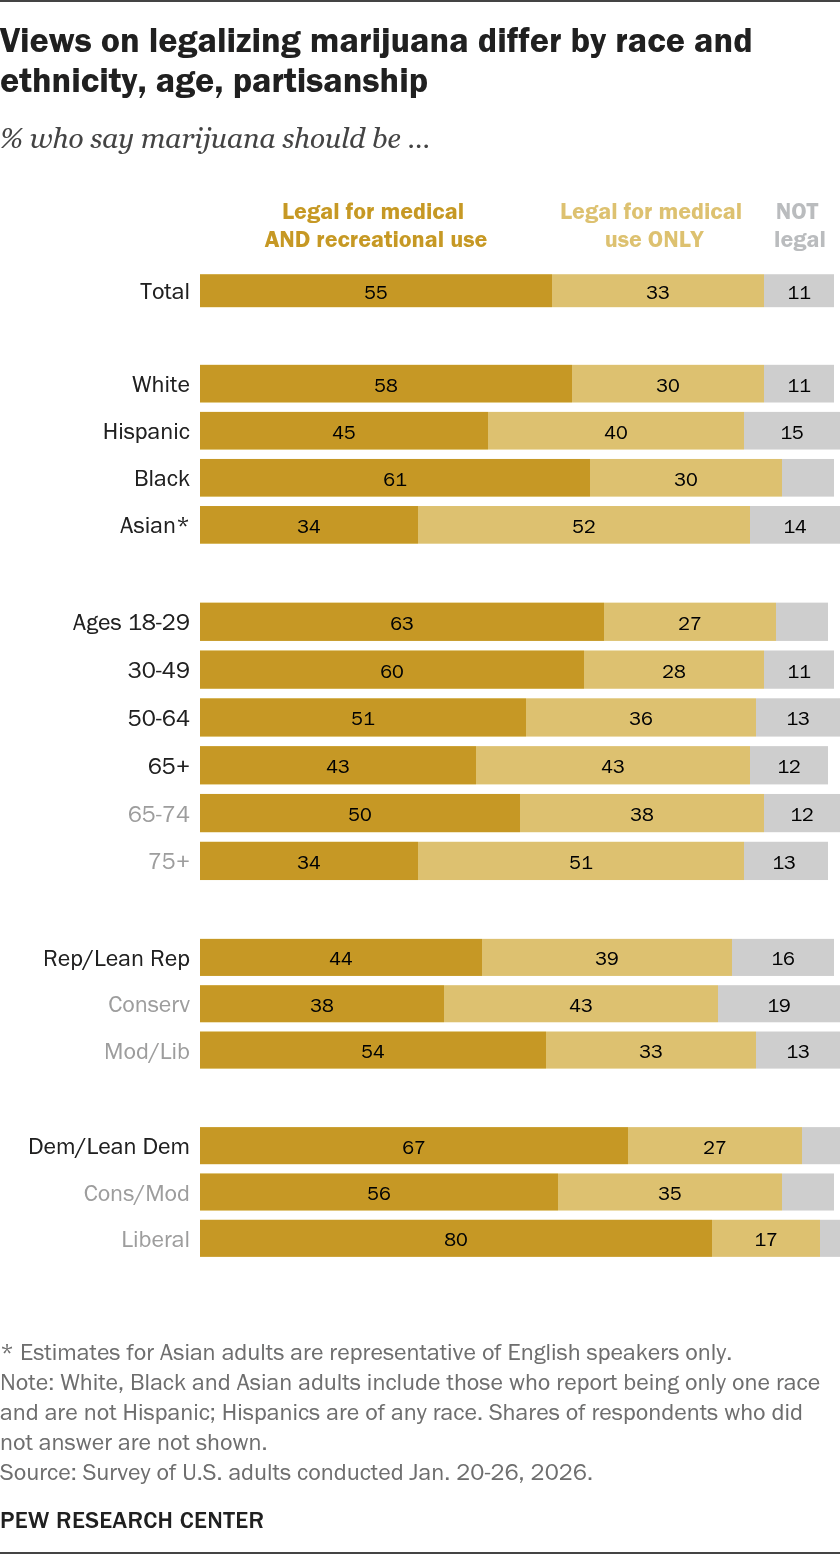
Views on legalizing marijuana differ by race and ethnicity, age, partisanship
% who say marijuana should be …
| Population | group | It should be legal for medical AND recreational use | It should be legal for medical use ONLY | It should NOT be legal |
|---|---|---|---|---|
| Total | total | 55 | 33 | 11 |
| White | race | 58 | 30 | 11 |
| Hispanic | race | 45 | 40 | 15 |
| Black | race | 61 | 30 | 8 |
| Asian* | race | 34 | 52 | 14 |
| Ages 18-29 | age | 63 | 27 | 8 |
| 30-49 | age | 60 | 28 | 11 |
| 50-64 | age | 51 | 36 | 13 |
| 65+ | age | 43 | 43 | 12 |
| 65-74 | age | 50 | 38 | 12 |
| 75+ | age | 34 | 51 | 13 |
| Rep/Lean Rep | rep | 44 | 39 | 16 |
| Conserv | rep | 38 | 43 | 19 |
| Mod/Lib | rep | 54 | 33 | 13 |
| Dem/Lean Dem | dem | 67 | 27 | 6 |
| Cons/Mod | dem | 56 | 35 | 8 |
| Liberal | dem | 80 | 17 | 3 |
* Estimates for Asian adults are representative of English speakers only.
Note: White, Black and Asian adults include those who report being only one race and are not Hispanic; Hispanics are of any race. Shares of respondents who did not answer are not shown.
Note: White, Black and Asian adults include those who report being only one race and are not Hispanic; Hispanics are of any race. Shares of respondents who did not answer are not shown.
Source: Survey of U.S. adults conducted Jan. 20-26, 2026.
PEW RESEARCH CENTER
