
How naturalized citizen eligible voters compare with U.S.-born eligible voters on demographic measures
% of eligible voters in each category, as of 2024
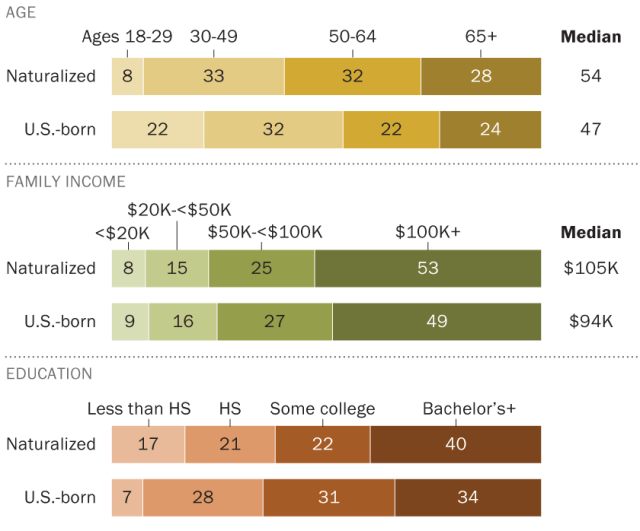
Note: Eligible voters are U.S. citizens ages 18 and older. U.S.-born eligible voters are those born in the U.S. or those born abroad to American parents. Medians are estimates.
Source: Pew Research Center analysis of 2024 American Community Survey (IPUMS).
PEW RESEARCH CENTER
How naturalized citizen eligible voters compare with U.S.-born eligible voters on demographic measures
% of eligible voters in each category, as of 2024
| Group | Share of naturalized eligible voters | Share of U.S.-born eligible voters | grouping |
|---|---|---|---|
| Ages 18-29 | 7.5 | 21.5 | age |
| 30-49 | 32.8 | 32.3 | age |
| 50-64 | 31.8 | 22.4 | age |
| 65+ | 28.0 | 23.7 | age |
| <$20K | 7.9 | 8.7 | income |
| $20K-<$50K | 14.7 | 15.9 | income |
| $50K-<$100K | 24.6 | 26.8 | income |
| $100K+ | 52.8 | 48.6 | income |
| Less than HS | 17.1 | 7.3 | school |
| HS | 21.0 | 28.0 | school |
| Some college | 22.1 | 30.6 | school |
| Bachelor’s+ | 39.8 | 34.1 | school |
Note: Eligible voters are U.S. citizens ages 18 and older. U.S.-born eligible voters are those born in the U.S. or those born abroad to American parents. Medians are estimates.
Source: Pew Research Center analysis of 2024 American Community Survey (IPUMS).
PEW RESEARCH CENTER

