How much have certain federal departments and agencies shrunk?
Headcount at Cabinet departments and larger independent agencies, as of …
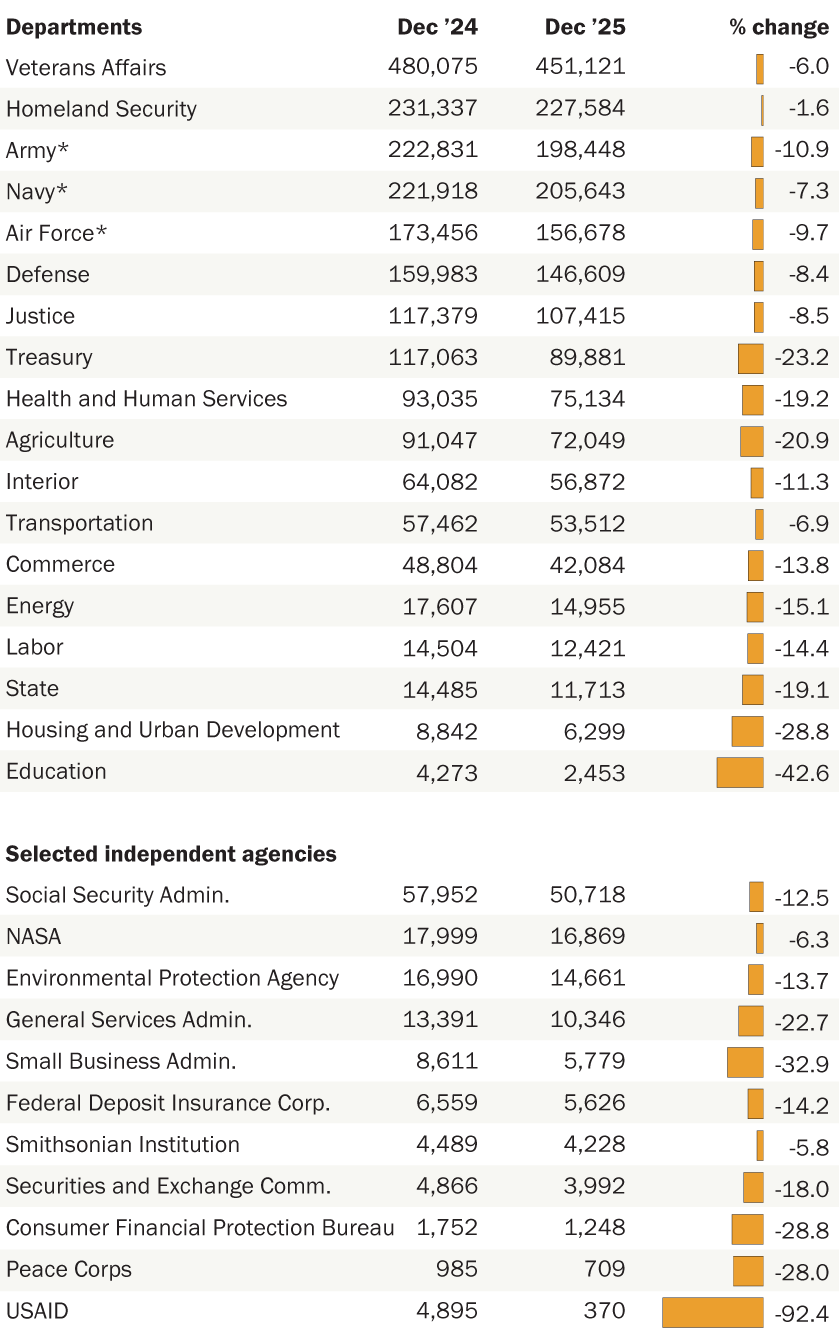
* Within the Defense Department but counted separately by OPM.
Source: Pew Research Center analysis of Office of Personnel Management data.
PEW RESEARCH CENTER
How much have certain federal departments and agencies shrunk?
Headcount at Cabinet departments and larger independent agencies, as of …
| Department/Agency | Group | Dec 2024 | Dec 2025 | % change |
|---|---|---|---|---|
| Veterans Affairs | Dept | 480075 | 451121 | -6.0% |
| Homeland Security | Dept | 231337 | 227584 | -1.6% |
| Army* | Dept | 222831 | 198448 | -10.9% |
| Navy* | Dept | 221918 | 205643 | -7.3% |
| Air Force* | Dept | 173456 | 156678 | -9.7% |
| Defense | Dept | 159983 | 146609 | -8.4% |
| Justice | Dept | 117379 | 107415 | -8.5% |
| Treasury | Dept | 117063 | 89881 | -23.2% |
| Health and Human Services | Dept | 93035 | 75134 | -19.2% |
| Agriculture | Dept | 91047 | 72049 | -20.9% |
| Interior | Dept | 64082 | 56872 | -11.3% |
| Transportation | Dept | 57462 | 53512 | -6.9% |
| Commerce | Dept | 48804 | 42084 | -13.8% |
| Energy | Dept | 17607 | 14955 | -15.1% |
| Labor | Dept | 14504 | 12421 | -14.4% |
| State | Dept | 14485 | 11713 | -19.1% |
| Housing and Urban Development | Dept | 8842 | 6299 | -28.8% |
| Education | Dept | 4273 | 2453 | -42.6% |
| Social Security Administration | Agencies | 57952 | 50718 | -12.5% |
| National Aeronautics and Space Administration | Agencies | 17999 | 16869 | -6.3% |
| Environmental Protection Agency | Agencies | 16990 | 14661 | -13.7% |
| General Services Administration | Agencies | 13391 | 10346 | -22.7% |
| Small Business Administration | Agencies | 8611 | 5779 | -32.9% |
| Federal Deposit Insurance Corporation | Agencies | 6559 | 5626 | -14.2% |
| Smithsonian Institution | Agencies | 4489 | 4228 | -5.8% |
| Securities and Exchange Commission | Agencies | 4866 | 3992 | -18.0% |
| Consumer Financial Protection Bureau | Agencies | 1752 | 1248 | -28.8 |
| Peace Corps | Agencies | 985 | 709 | -28.0 |
| U.S. Agency for International Development | Agencies | 4895 | 370 | -92.4% |
* Within the Defense Department but counted separately by OPM.
Source: Pew Research Center analysis of Office of Personnel Management data.
PEW RESEARCH CENTER
