
Gender pay gap by age cohort
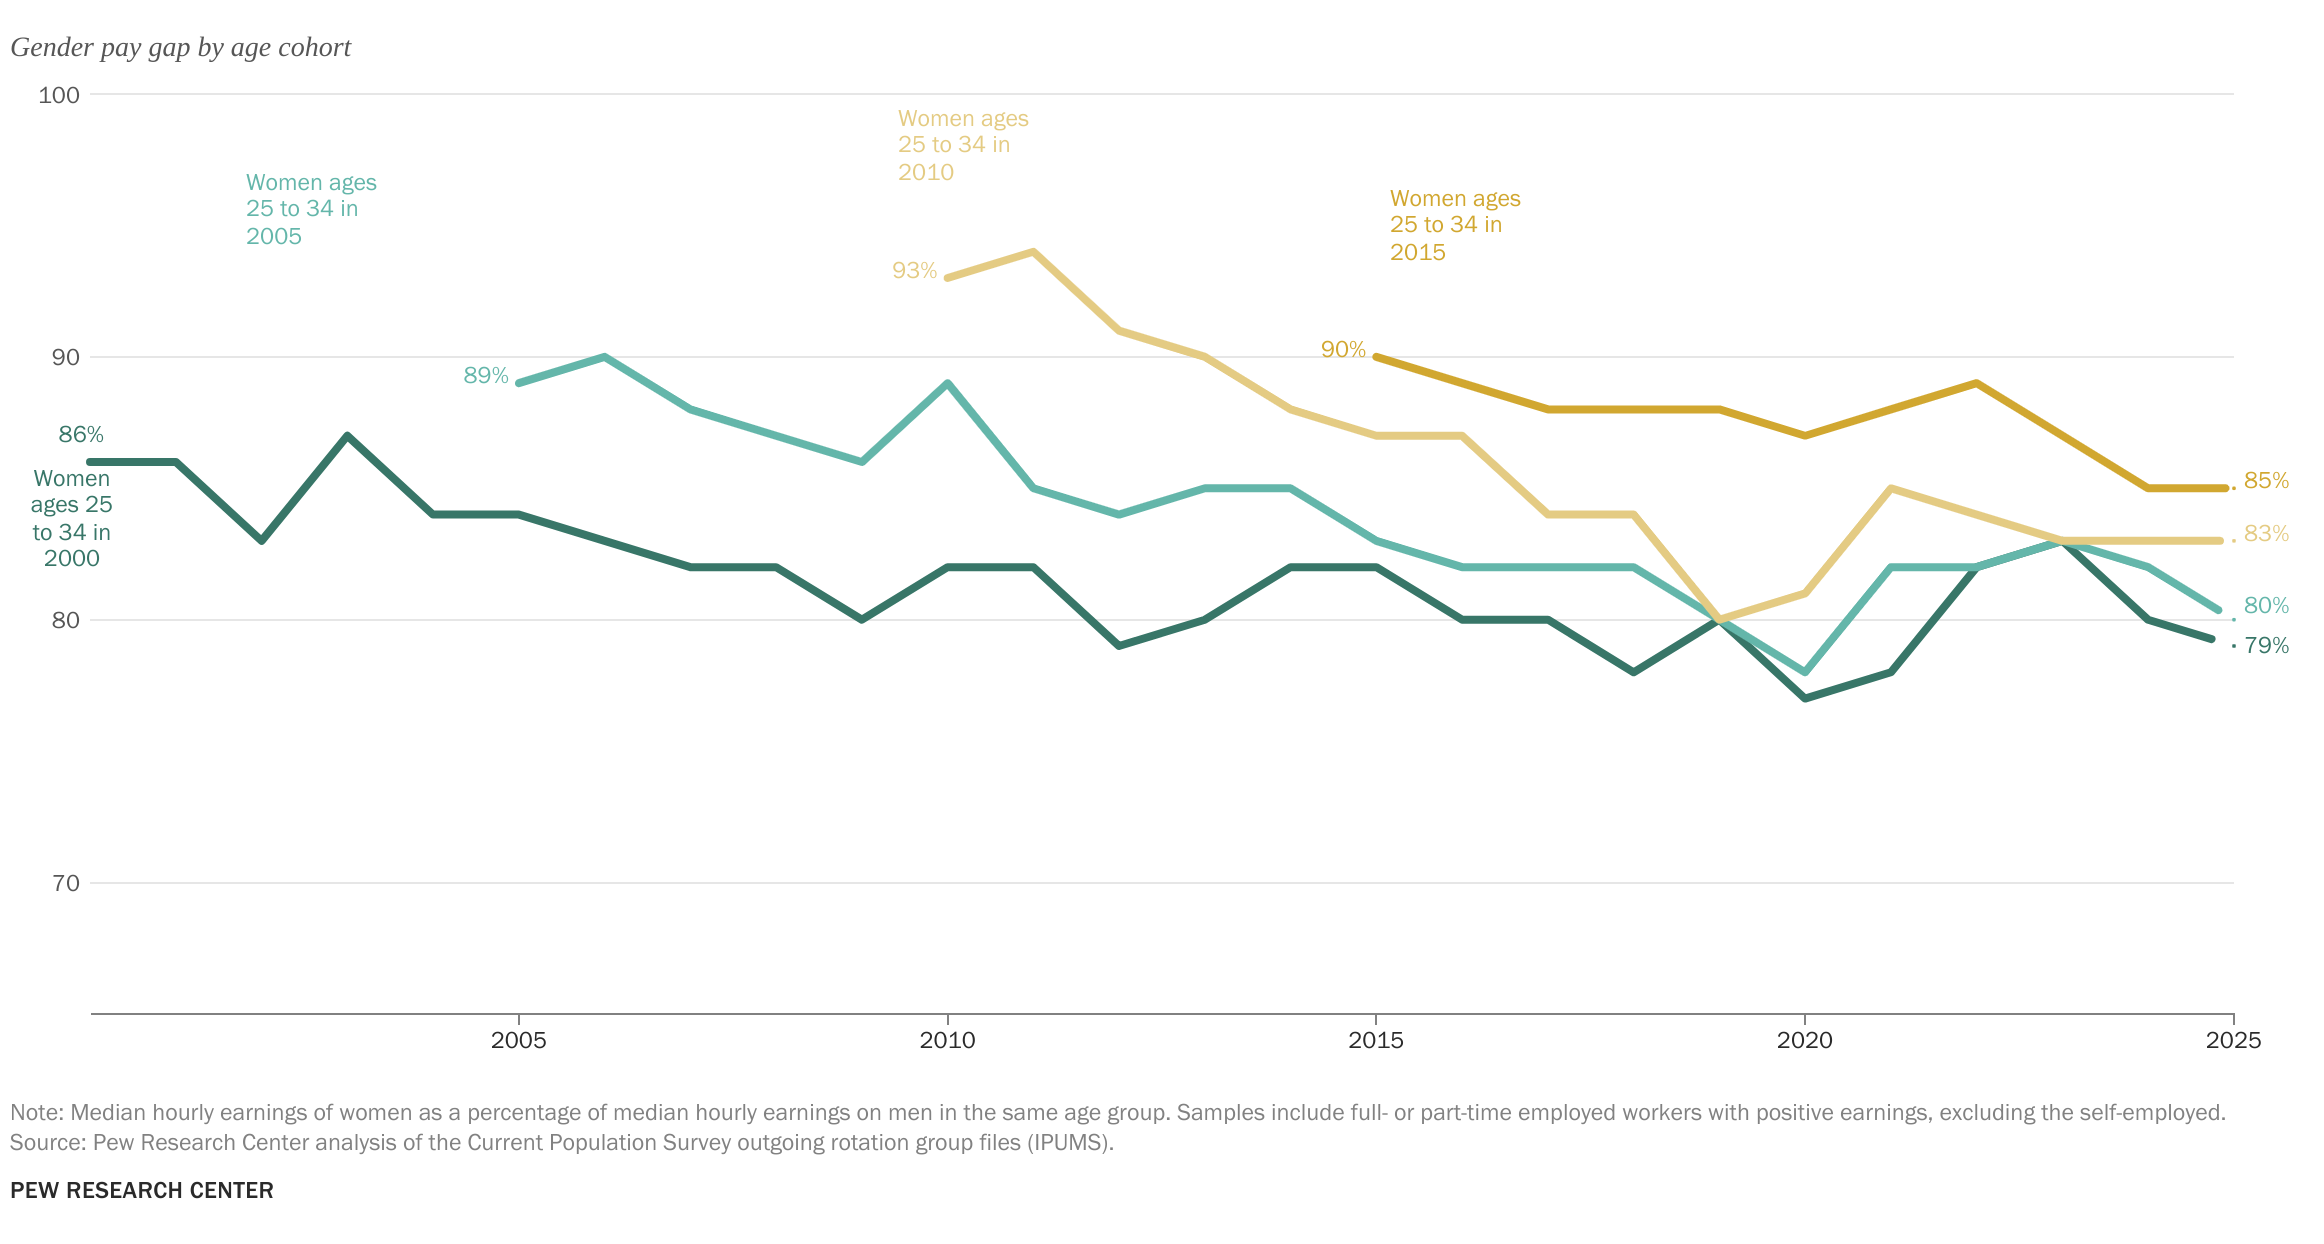
Note: Median hourly earnings of women as a percentage of median hourly earnings on men in the same age group. Samples include full- or part-time employed workers with positive earnings, excluding the self-employed.
Source: Pew Research Center analysis of the Current Population Survey outgoing rotation group files (IPUMS).
PEW RESEARCH CENTER
Gender pay gap by age cohort
| Year | Women ages 25 to 34 in 2000 | Women ages 25 to 34 in 2005 | Women ages 25 to 34 in 2010 | Women ages 25 to 34 in 2015 |
|---|---|---|---|---|
| 2000 | 86% | |||
| 2001 | 86% | |||
| 2002 | 83% | |||
| 2003 | 87% | |||
| 2004 | 84% | |||
| 2005 | 84% | 89% | ||
| 2006 | 83% | 90% | ||
| 2007 | 82% | 88% | ||
| 2008 | 82% | 87% | ||
| 2009 | 80% | 86% | ||
| 2010 | 82% | 89% | 93% | |
| 2011 | 82% | 85% | 94% | |
| 2012 | 79% | 84% | 91% | |
| 2013 | 80% | 85% | 90% | |
| 2014 | 82% | 85% | 88% | |
| 2015 | 82% | 83% | 87% | 90% |
| 2016 | 80% | 82% | 87% | 89% |
| 2017 | 80% | 82% | 84% | 88% |
| 2018 | 78% | 82% | 84% | 88% |
| 2019 | 80% | 80% | 80% | 88% |
| 2020 | 77% | 78% | 81% | 87% |
| 2021 | 78% | 82% | 85% | 88% |
| 2022 | 82% | 82% | 84% | 89% |
| 2023 | 83% | 83% | 83% | 87% |
| 2024 | 80% | 82% | 83% | 85% |
| 2025 | 79% | 80% | 83% | 85% |
Note: Median hourly earnings of women as a percentage of median hourly earnings on men in the same age group. Samples include full- or part-time employed workers with positive earnings, excluding the self-employed.
Source: Pew Research Center analysis of the Current Population Survey outgoing rotation group files (IPUMS).
PEW RESEARCH CENTER

