From 2020-25, religious affiliation was generally stable in most U.S. regions
% of adults in each region who identify with a religion
Source: Pew Research Center’s National Public Opinion Reference Surveys (2020-25) and 2023-24 U.S. Religious Landscape Study.
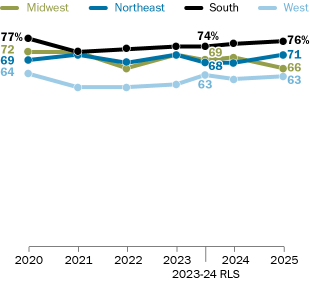
From 2020-25, religious affiliation was generally stable in most U.S. regions
% of adults in each region who identify with a religion
| South | Midwest | West | Northeast | |
|---|---|---|---|---|
| 2020 | 77 | 72 | 64 | 69 |
| 2021 | 72 | 72 | 59 | 71 |
| 2022 | 73 | 66 | 59 | 68 |
| 2023 | 74 | 71 | 60 | 71 |
| 2023-24 RLS | 74 | 69 | 68 | 63 |
| 2024 | 75 | 70 | 62 | 68 |
| 2025 | 76 | 66 | 63 | 71 |
Source: Pew Research Center’s National Public Opinion Reference Surveys (2020-25) and 2023-24 U.S. Religious Landscape Study.
