Federal worker employment fell in 2025 …
Headcount as of December in each year
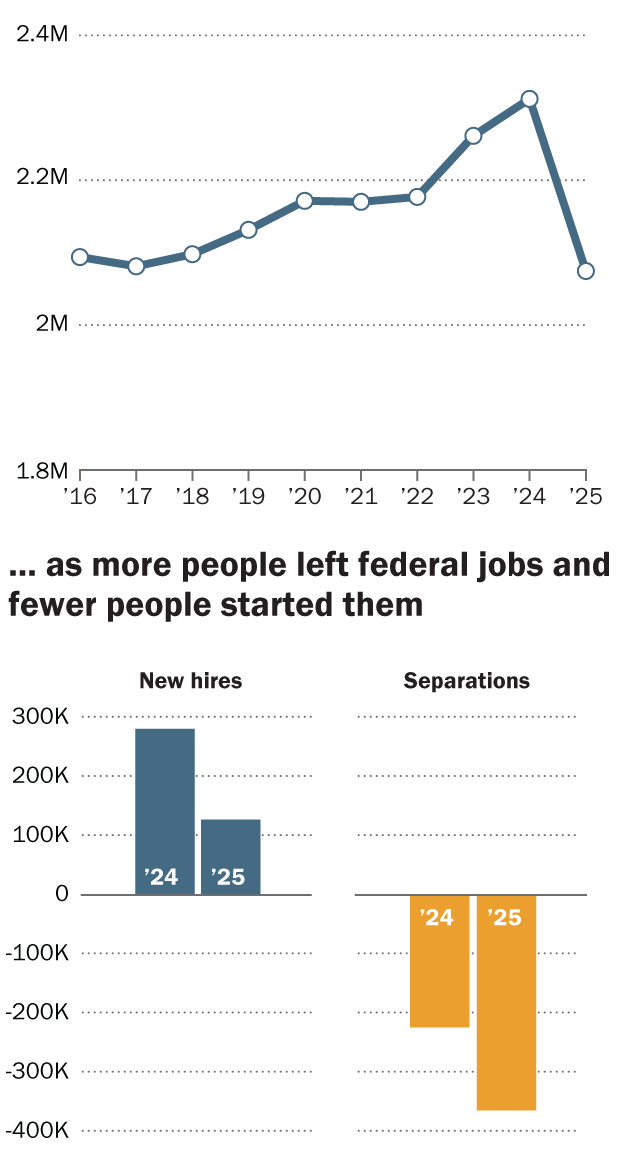
Note: Figures for new hires exclude people who transferred into publicly reported federal jobs from elsewhere in the federal government. “Separations” includes quits, retirements, terminations and other means by which people left federal employment, but excludes those who transferred to a federal job outside OPM’s publicly reported dataset.
Source: Pew Research Center analysis of Office of Personnel Management data.
PEW RESEARCH CENTER
Federal worker employment fell in 2025 …
Headcount as of December in each year
| Year | Federal workers | New hires | Separations |
|---|---|---|---|
| 2016 | 2093868 | ||
| 2017 | 2081160 | ||
| 2018 | 2097881 | ||
| 2019 | 2131465 | ||
| 2020 | 2171513 | ||
| 2021 | 2170157 | ||
| 2022 | 2176983 | ||
| 2023 | 2261282 | ||
| 2024 | 2312301 | 263433 | -192562 |
| 2025 | 2074649 | 116912 | -348219 |
Note: Figures for new hires exclude people who transferred into publicly reported federal jobs from elsewhere in the federal government. “Separations” includes quits, retirements, terminations and other means by which people left federal employment, but excludes those who transferred to a federal job outside OPM’s publicly reported dataset.
Source: Pew Research Center analysis of Office of Personnel Management data.
PEW RESEARCH CENTER
