Connecticut, Florida and New Jersey have largest shares of Puerto Ricans
% of the population that is of Puerto Rican origin, 2024
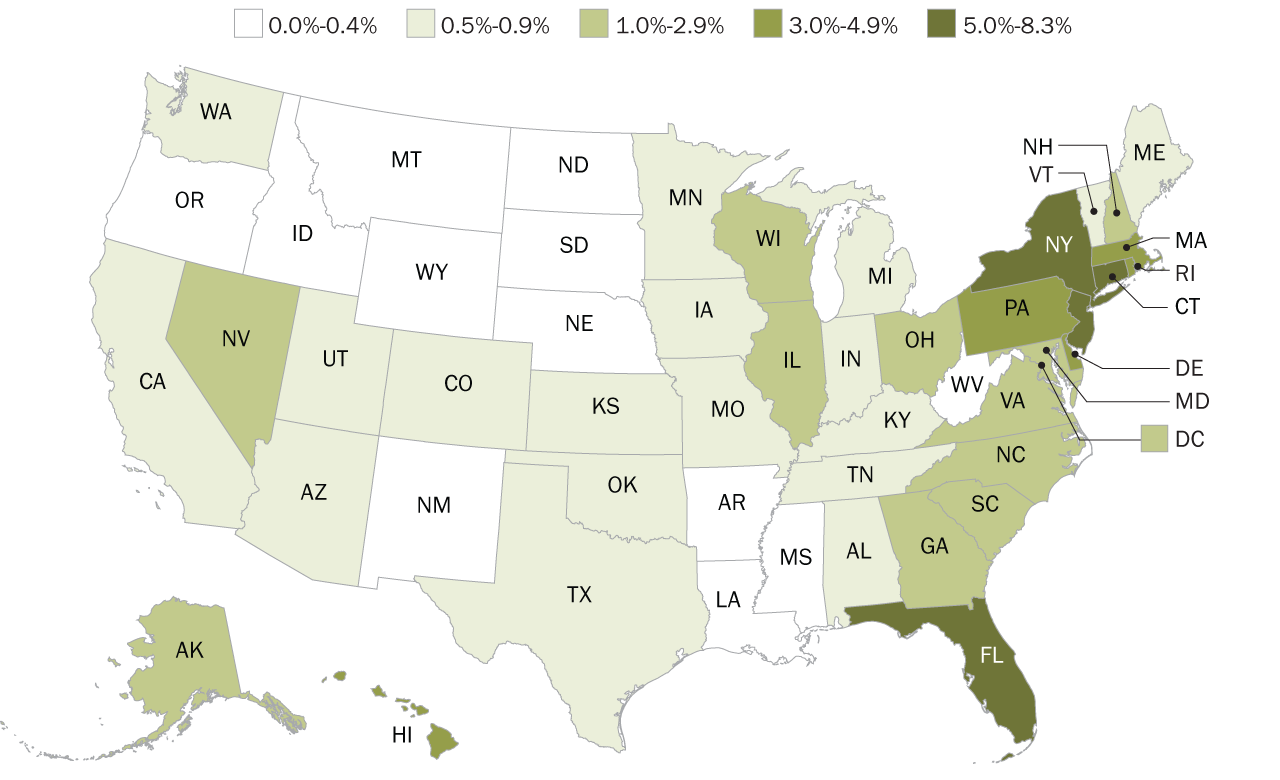
Source: Pew Research Center analysis of the American Community Survey (IPUMS USA).
PEW RESEARCH CENTER
Connecticut, Florida and New Jersey have largest shares of Puerto Ricans
% of the population that is of Puerto Rican origin, 2024
| State | FIPS | % of the population that is of Puerto Rican origin, 2024 | Category |
|---|---|---|---|
| Alabama | 01 | 0.6% | 0.6%-1.0% |
| Alaska | 02 | 1.3% | 1.1%-3.0% |
| Arizona | 04 | 0.9% | 0.6%-1.0% |
| Arkansas | 05 | 0.4% | 0.0%-0.5% |
| California | 06 | 0.5% | 0.0%-0.5% |
| Colorado | 08 | 0.8% | 0.6%-1.0% |
| Connecticut | 09 | 8.3% | 6.1%-9.0% |
| Delaware | 10 | 3.3% | 3.1%-6.0% |
| District of Columbia | 11 | 1.2% | 1.1%-3.0% |
| Florida | 12 | 5.6% | 3.1%-6.0% |
| Georgia | 13 | 1.2% | 1.1%-3.0% |
| Hawaii | 15 | 3.0% | 1.1%-3.0% |
| Idaho | 16 | 0.2% | 0.0%-0.5% |
| Illinois | 17 | 1.5% | 1.1%-3.0% |
| Indiana | 18 | 0.7% | 0.6%-1.0% |
| Iowa | 19 | 0.6% | 0.6%-1.0% |
| Kansas | 20 | 0.8% | 0.6%-1.0% |
| Kentucky | 21 | 0.6% | 0.6%-1.0% |
| Louisiana | 22 | 0.4% | 0.0%-0.5% |
| Maine | 23 | 0.6% | 0.6%-1.0% |
| Maryland | 24 | 1.2% | 1.1%-3.0% |
| Massachusetts | 25 | 4.7% | 3.1%-6.0% |
| Michigan | 26 | 0.6% | 0.6%-1.0% |
| Minnesota | 27 | 0.5% | 0.0%-0.5% |
| Mississippi | 28 | 0.3% | 0.0%-0.5% |
| Missouri | 29 | 0.5% | 0.0%-0.5% |
| Montana | 30 | 0.1% | 0.0%-0.5% |
| Nebraska | 31 | 0.3% | 0.0%-0.5% |
| Nevada | 32 | 1.1% | 1.1%-3.0% |
| New Hampshire | 33 | 1.5% | 1.1%-3.0% |
| New Jersey | 34 | 5.1% | 3.1%-6.0% |
| New Mexico | 35 | 0.4% | 0.0%-0.5% |
| New York | 36 | 5.0% | 3.1%-6.0% |
| North Carolina | 37 | 1.4% | 1.1%-3.0% |
| North Dakota | 38 | 0.2% | 0.0%-0.5% |
| Ohio | 39 | 1.3% | 1.1%-3.0% |
| Oklahoma | 40 | 0.6% | 0.6%-1.0% |
| Oregon | 41 | 0.4% | 0.0%-0.5% |
| Pennsylvania | 42 | 3.8% | 3.1%-6.0% |
| Rhode Island | 44 | 4.5% | 3.1%-6.0% |
| South Carolina | 45 | 1.1% | 1.1%-3.0% |
| South Dakota | 46 | 0.1% | 0.0%-0.5% |
| Tennessee | 47 | 0.6% | 0.6%-1.0% |
| Texas | 48 | 0.8% | 0.6%-1.0% |
| Utah | 49 | 0.5% | 0.0%-0.5% |
| Vermont | 50 | 0.7% | 0.6%-1.0% |
| Virginia | 51 | 1.3% | 1.1%-3.0% |
| Washington | 53 | 0.6% | 0.6%-1.0% |
| West Virginia | 54 | 0.3% | 0.0%-0.5% |
| Wisconsin | 55 | 1.3% | 1.1%-3.0% |
| Wyoming | 56 | 0.3% | 0.0%-0.5% |
Source: Pew Research Center analysis of the American Community Survey (IPUMS USA).
PEW RESEARCH CENTER
