
A look at the changing number of legal abortions in the U.S. since the 1970s
Number of legal induced abortions per year in U.S., according to two different organizations
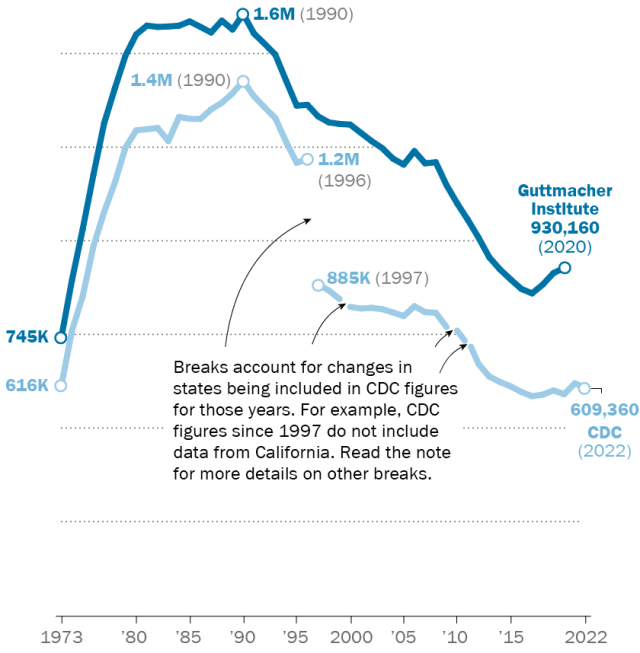
Note: Guttmacher data for 1983, 1986, 1989-90, 1993-94, 1997-98, 2001-03, 2006, 2009, 2012, 2015 and 2018 are estimates from Guttmacher. CDC totals from 1973 to 1996 include all 50 states and D.C. To allow for comparison, CDC data since 1997 excludes states that did not report data each year of the specified time period. CDC data in this graphic from 1997-99 excludes Alaska, California, Louisiana, New Hampshire, Oklahoma and West Virginia. CDC data from 2000-09 excludes Alaska, California, Delaware, Louisiana, Maryland, New Hampshire and West Virginia. CDC data from 2010-11 excludes California, Maryland, New Hampshire and D.C. CDC data from 2012-22 excludes California, Maryland, New Hampshire, New Jersey and D.C.
Sources: Guttmacher Institute; Centers for Disease Control and Prevention.
PEW RESEARCH CENTER
A look at the changing number of legal abortions in the U.S. since the 1970s
Number of legal induced abortions per year in U.S., according to two different organizations
| Year | Guttmacher | CDC |
|---|---|---|
| 1973 | 744,600 | 615,831 |
| 1974 | 898,600 | 763,476 |
| 1975 | 1,034,200 | 854,853 |
| 1976 | 1,179,300 | 988,267 |
| 1977 | 1,316,700 | 1,079,430 |
| 1978 | 1,409,600 | 1,157,780 |
| 1979 | 1,497,700 | 1,251,920 |
| 1980 | 1,553,900 | 1,297,610 |
| 1981 | 1,577,300 | 1,300,760 |
| 1982 | 1,573,900 | 1,303,980 |
| 1983 | 1,575,000 | 1,268,990 |
| 1984 | 1,577,200 | 1,333,520 |
| 1985 | 1,588,600 | 1,328,570 |
| 1986 | 1,574,000 | 1,328,110 |
| 1987 | 1,559,100 | 1,353,670 |
| 1988 | 1,590,800 | 1,371,280 |
| 1989 | 1,566,900 | 1,396,660 |
| 1990 | 1,608,600 | 1,429,580 |
| 1991 | 1,556,500 | 1,388,940 |
| 1992 | 1,528,900 | 1,359,140 |
| 1993 | 1,500,000 | 1,330,410 |
| 1994 | 1,431,000 | 1,267,420 |
| 1995 | 1,363,700 | 1,210,880 |
| 1996 | 1,365,700 | 1,221,580 |
| 1997 | 1,335,000 | 885,624 |
| 1998 | 1,319,000 | 870,184 |
| 1999 | 1,314,800 | 847,283 |
| 2000 | 1,313,000 | 826,123 |
| 2001 | 1,291,000 | 821,850 |
| 2002 | 1,269,000 | 823,534 |
| 2003 | 1,250,000 | 820,052 |
| 2004 | 1,222,100 | 811,381 |
| 2005 | 1,206,200 | 801,577 |
| 2006 | 1,242,200 | 827,888 |
| 2007 | 1,209,600 | 812,273 |
| 2008 | 1,212,400 | 810,403 |
| 2009 | 1,151,600 | 772,630 |
| 2010 | 1,102,700 | 762,755 |
| 2011 | 1,058,500 | 727,554 |
| 2012 | 1,011,000 | 673,634 |
| 2013 | 958,700 | 640,154 |
| 2014 | 926,200 | 625,668 |
| 2015 | 899,500 | 613,911 |
| 2016 | 874,100 | 599,001 |
| 2017 | 862,320 | 587,611 |
| 2018 | 885,800 | 591,884 |
| 2019 | 916,460 | 603,168 |
| 2020 | 930,160 | 592,939 |
| 2021 | — | 622,108 |
| 2022 | — | 609,360 |
Note: Guttmacher data for 1983, 1986, 1989-90, 1993-94, 1997-98, 2001-03, 2006, 2009, 2012, 2015 and 2018 are estimates from Guttmacher. CDC totals from 1973 to 1996 include all 50 states and D.C. To allow for comparison, CDC data since 1997 excludes states that did not report data each year of the specified time period. CDC data in this graphic from 1997-99 excludes Alaska, California, Louisiana, New Hampshire, Oklahoma and West Virginia. CDC data from 2000-09 excludes Alaska, California, Delaware, Louisiana, Maryland, New Hampshire and West Virginia. CDC data from 2010-11 excludes California, Maryland, New Hampshire and D.C. CDC data from 2012-22 excludes California, Maryland, New Hampshire, New Jersey and D.C.
Sources: Guttmacher Institute; Centers for Disease Control and Prevention.
PEW RESEARCH CENTER
