
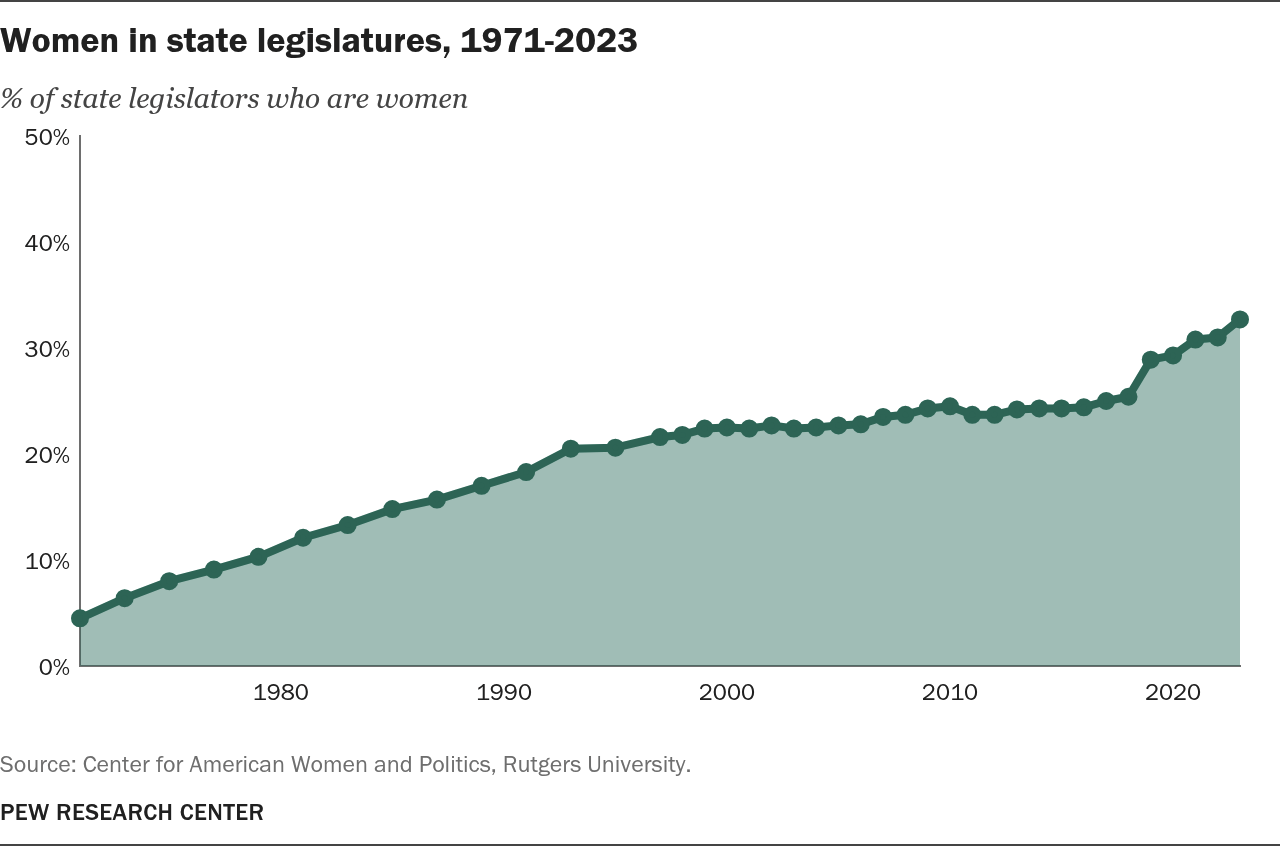
Women in state legislatures, 1971-2023
% of state legislators who are women
Source: Center for American Women and Politics, Rutgers University.
PEW RESEARCH CENTER
Women in state legislatures, 1971-2023
% of state legislators who are women
| Year | Share of state legislators who are women |
|---|---|
| 1971 | 4.5% |
| 1973 | 6.4% |
| 1975 | 8.0% |
| 1977 | 9.1% |
| 1979 | 10.3% |
| 1981 | 12.1% |
| 1983 | 13.3% |
| 1985 | 14.8% |
| 1987 | 15.7% |
| 1989 | 17.0% |
| 1991 | 18.3% |
| 1993 | 20.5% |
| 1995 | 20.6% |
| 1997 | 21.6% |
| 1998 | 21.8% |
| 1999 | 22.4% |
| 2000 | 22.5% |
| 2001 | 22.4% |
| 2002 | 22.7% |
| 2003 | 22.4% |
| 2004 | 22.5% |
| 2005 | 22.7% |
| 2006 | 22.8% |
| 2007 | 23.5% |
| 2008 | 23.7% |
| 2009 | 24.3% |
| 2010 | 24.5% |
| 2011 | 23.7% |
| 2012 | 23.7% |
| 2013 | 24.2% |
| 2014 | 24.3% |
| 2015 | 24.3% |
| 2016 | 24.4% |
| 2017 | 25.0% |
| 2018 | 25.4% |
| 2019 | 28.9% |
| 2020 | 29.3% |
| 2021 | 30.8% |
| 2022 | 31.00% |
| 2023 | 32.70% |
Source: Center for American Women and Politics, Rutgers University.
PEW RESEARCH CENTER
