
Fossil fuels still dominate globally, but renewable sources are growing
% of global electricity generated from each source
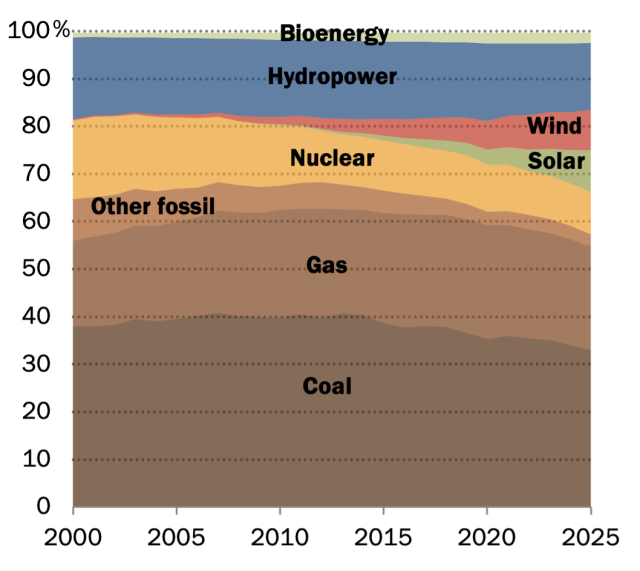
Note: “Other fossil” includes generation from oil and petroleum products and manufactured gases and waste. “Other renewables,” which includes geothermal, tidal and wave power, is not shown (<1%).
Source: Ember, “Yearly Electricity Data” (accessed June 23, 2026).
PEW RESEARCH CENTER
Fossil fuels still dominate globally, but renewable sources are growing
% of global electricity generated from each source
| Year | Coal (%) | Gas | Nuclear | Solar | Wind | Hydropower | Bioenergy | Other fossil | Other renewables |
|---|---|---|---|---|---|---|---|---|---|
| 2000 | 38.02 | 17.97 | 16.63 | 0.01 | 0.2 | 17.21 | 1.01 | 8.67 | 0.29 |
| 2001 | 38 | 18.8 | 16.86 | 0.01 | 0.25 | 16.54 | 0.96 | 8.29 | 0.28 |
| 2002 | 38.28 | 19.34 | 16.54 | 0.01 | 0.33 | 16.27 | 1.01 | 7.92 | 0.29 |
| 2003 | 39.54 | 19.58 | 15.64 | 0.01 | 0.38 | 15.71 | 1.06 | 7.8 | 0.28 |
| 2004 | 39.03 | 20.12 | 15.62 | 0.02 | 0.49 | 16.09 | 1.1 | 7.26 | 0.28 |
| 2005 | 39.52 | 20.3 | 15.04 | 0.02 | 0.58 | 16.06 | 1.17 | 7.05 | 0.27 |
| 2006 | 40.17 | 20.7 | 14.66 | 0.03 | 0.71 | 16.02 | 1.2 | 6.24 | 0.27 |
| 2007 | 40.84 | 21.4 | 13.71 | 0.04 | 0.87 | 15.54 | 1.26 | 6.07 | 0.27 |
| 2008 | 40.16 | 21.69 | 13.4 | 0.06 | 1.1 | 16.14 | 1.33 | 5.83 | 0.28 |
| 2009 | 39.87 | 21.97 | 13.32 | 0.1 | 1.39 | 16.25 | 1.44 | 5.37 | 0.29 |
| 2010 | 39.78 | 22.61 | 12.82 | 0.15 | 1.63 | 16.12 | 1.54 | 5.07 | 0.28 |
| 2011 | 40.56 | 22.15 | 11.88 | 0.29 | 2 | 15.88 | 1.57 | 5.4 | 0.28 |
| 2012 | 39.8 | 22.92 | 10.8 | 0.43 | 2.35 | 16.26 | 1.66 | 5.5 | 0.28 |
| 2013 | 40.7 | 21.85 | 10.57 | 0.57 | 2.74 | 16.37 | 1.76 | 5.17 | 0.28 |
| 2014 | 40.44 | 21.96 | 10.52 | 0.83 | 2.97 | 16.3 | 1.86 | 4.82 | 0.29 |
| 2015 | 38.68 | 23.08 | 10.55 | 1.07 | 3.46 | 16.17 | 1.97 | 4.72 | 0.3 |
| 2016 | 37.77 | 23.69 | 10.41 | 1.33 | 3.89 | 16.26 | 1.95 | 4.39 | 0.31 |
| 2017 | 37.95 | 23.48 | 10.2 | 1.75 | 4.48 | 15.94 | 1.99 | 3.91 | 0.31 |
| 2018 | 37.91 | 23.52 | 10.05 | 2.17 | 4.79 | 15.78 | 2.03 | 3.43 | 0.31 |
| 2019 | 36.62 | 23.86 | 10.26 | 2.6 | 5.3 | 15.76 | 2.11 | 3.19 | 0.31 |
| 2020 | 35.32 | 23.89 | 9.91 | 3.19 | 5.96 | 16.27 | 2.25 | 2.88 | 0.32 |
| 2021 | 35.96 | 23.22 | 9.78 | 3.73 | 6.57 | 15.18 | 2.32 | 2.94 | 0.31 |
| 2022 | 35.43 | 22.93 | 9.13 | 4.61 | 7.29 | 14.97 | 2.31 | 3.02 | 0.3 |
| 2023 | 35.05 | 22.59 | 9.09 | 5.61 | 7.82 | 14.31 | 2.3 | 2.91 | 0.3 |
| 2024 | 34.1 | 22.25 | 8.98 | 6.93 | 8.11 | 14.35 | 2.27 | 2.71 | 0.29 |
| 2025 | 33.06 | 21.73 | 8.85 | 8.76 | 8.55 | 13.97 | 2.22 | 2.58 | 0.28 |
Note: “Other fossil” includes generation from oil and petroleum products and manufactured gases and waste. “Other renewables,” which includes geothermal, tidal and wave power, is not shown (<1%).
Source: Ember, “Yearly Electricity Data” (accessed June 23, 2026).
PEW RESEARCH CENTER
