
U.S. gun suicide rate is at a near-record high; gun homicide rate has dropped since 2021
Gun deaths per 100,000 people (age-adjusted), by type
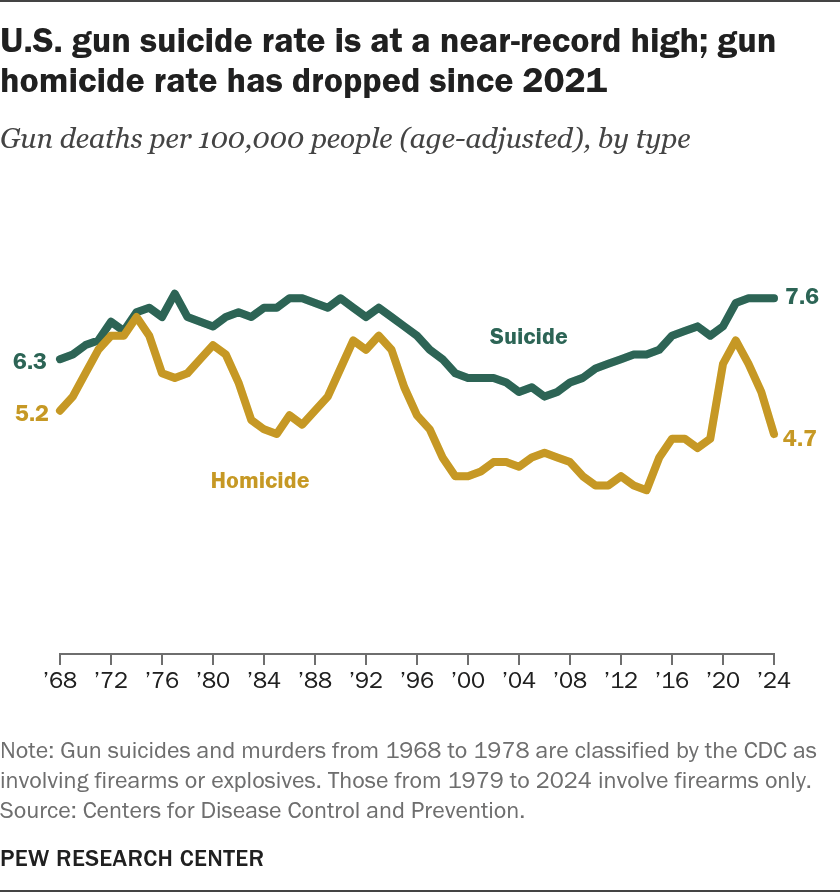
Note: Gun suicides and murders from 1968 to 1978 are classified by the CDC as involving firearms or explosives. Those from 1979 to 2024 involve firearms only.
Source: Centers for Disease Control and Prevention.
PEW RESEARCH CENTER
U.S. gun suicide rate is at a near-record high; gun homicide rate has dropped since 2021
Gun deaths per 100,000 people (age-adjusted), by type
| Year | Suicide | Homicide |
|---|---|---|
| 1968 | 6.3 | 5.2 |
| 1969 | 6.4 | 5.5 |
| 1970 | 6.6 | 6.0 |
| 1971 | 6.7 | 6.5 |
| 1972 | 7.1 | 6.8 |
| 1973 | 6.9 | 6.8 |
| 1974 | 7.3 | 7.2 |
| 1975 | 7.4 | 6.8 |
| 1976 | 7.2 | 6.0 |
| 1977 | 7.7 | 5.9 |
| 1978 | 7.2 | 6.0 |
| 1979 | 7.1 | 6.3 |
| 1980 | 7.0 | 6.6 |
| 1981 | 7.2 | 6.4 |
| 1982 | 7.3 | 5.8 |
| 1983 | 7.2 | 5.0 |
| 1984 | 7.4 | 4.8 |
| 1985 | 7.4 | 4.7 |
| 1986 | 7.6 | 5.1 |
| 1987 | 7.6 | 4.9 |
| 1988 | 7.5 | 5.2 |
| 1989 | 7.4 | 5.5 |
| 1990 | 7.6 | 6.1 |
| 1991 | 7.4 | 6.7 |
| 1992 | 7.2 | 6.5 |
| 1993 | 7.4 | 6.8 |
| 1994 | 7.2 | 6.5 |
| 1995 | 7.0 | 5.7 |
| 1996 | 6.8 | 5.1 |
| 1997 | 6.5 | 4.8 |
| 1998 | 6.3 | 4.2 |
| 1999 | 6.0 | 3.8 |
| 2000 | 5.9 | 3.8 |
| 2001 | 5.9 | 3.9 |
| 2002 | 5.9 | 4.1 |
| 2003 | 5.8 | 4.1 |
| 2004 | 5.6 | 4.0 |
| 2005 | 5.7 | 4.2 |
| 2006 | 5.5 | 4.3 |
| 2007 | 5.6 | 4.2 |
| 2008 | 5.8 | 4.1 |
| 2009 | 5.9 | 3.8 |
| 2010 | 6.1 | 3.6 |
| 2011 | 6.2 | 3.6 |
| 2012 | 6.3 | 3.8 |
| 2013 | 6.4 | 3.6 |
| 2014 | 6.4 | 3.5 |
| 2015 | 6.5 | 4.2 |
| 2016 | 6.8 | 4.6 |
| 2017 | 6.9 | 4.6 |
| 2018 | 7.0 | 4.4 |
| 2019 | 6.8 | 4.6 |
| 2020 | 7.0 | 6.2 |
| 2021 | 7.5 | 6.7 |
| 2022 | 7.6 | 6.2 |
| 2023 | 7.6 | 5.6 |
| 2024 | 7.6 | 4.7 |
Note: Gun suicides and murders from 1968 to 1978 are classified by the CDC as involving firearms or explosives. Those from 1979 to 2024 involve firearms only.
Source: Centers for Disease Control and Prevention.
PEW RESEARCH CENTER
