
U.S. gun death rates vary widely by state
Gun deaths per 100,000 people in 2024 (age-adjusted), by state
Note: Includes gun suicides, gun homicides, and gun deaths that involved law enforcement, were accidental or had undetermined circumstances.
Source: Centers for Disease Control and Prevention.
PEW RESEARCH CENTER
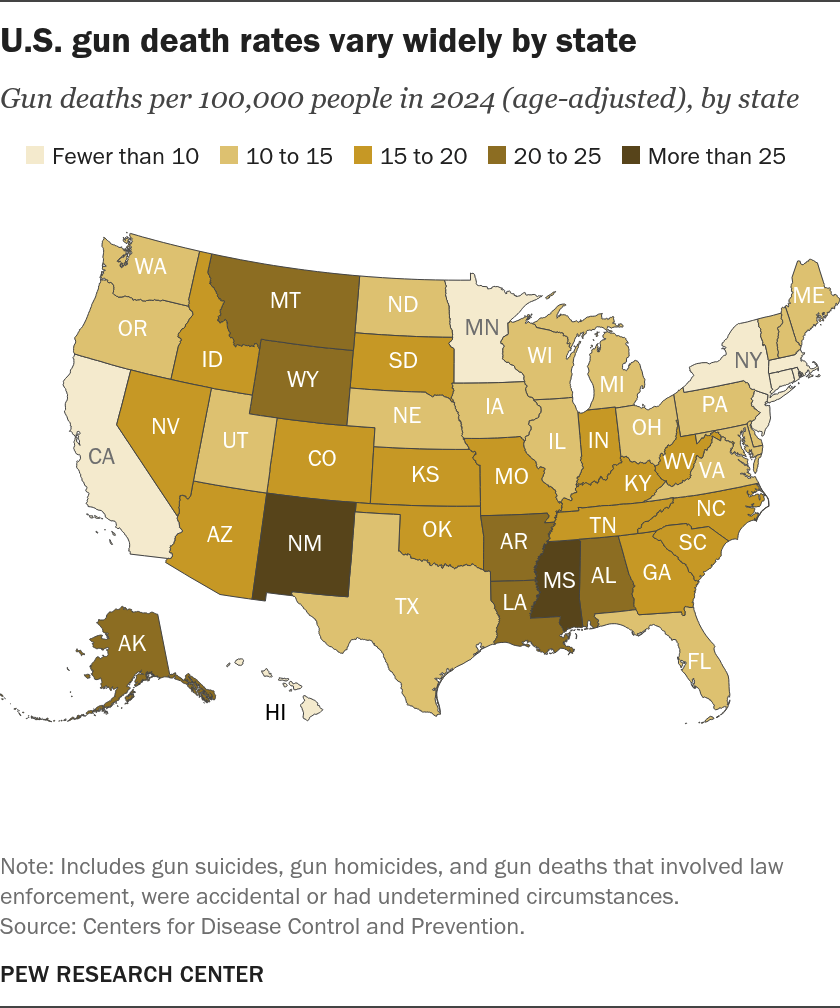
U.S. gun death rates vary widely by state
Gun deaths per 100,000 people in 2024 (age-adjusted), by state
| FIPS | State | Gun deaths per 100,000 people in 2024 (age-adjusted) |
|---|---|---|
| 01 | Alabama | 23.7 |
| 02 | Alaska | 24.4 |
| 04 | Arizona | 16.9 |
| 05 | Arkansas | 20.6 |
| 06 | California | 7.0 |
| 08 | Colorado | 15.3 |
| 09 | Connecticut | 5.8 |
| 10 | Delaware | 11.8 |
| 11 | District of Columbia | 19.7 |
| 12 | Florida | 12.7 |
| 13 | Georgia | 17.6 |
| 15 | Hawaii | 3.7 |
| 16 | Idaho | 15.9 |
| 17 | Illinois | 12.4 |
| 18 | Indiana | 17.2 |
| 19 | Iowa | 11.8 |
| 20 | Kansas | 15.2 |
| 21 | Kentucky | 18.5 |
| 22 | Louisiana | 22.9 |
| 23 | Maine | 11.9 |
| 24 | Maryland | 11.6 |
| 25 | Massachusetts | 3.8 |
| 26 | Michigan | 11.9 |
| 27 | Minnesota | 9.8 |
| 28 | Mississippi | 28.0 |
| 29 | Missouri | 19.6 |
| 30 | Montana | 20.2 |
| 31 | Nebraska | 10.9 |
| 32 | Nevada | 17.2 |
| 33 | New Hampshire | 10.2 |
| 34 | New Jersey | 4.0 |
| 35 | New Mexico | 26.6 |
| 36 | New York | 4.4 |
| 37 | North Carolina | 16.3 |
| 38 | North Dakota | 12.2 |
| 39 | Ohio | 14.6 |
| 40 | Oklahoma | 19.1 |
| 41 | Oregon | 14.2 |
| 42 | Pennsylvania | 11.9 |
| 44 | Rhode Island | 4.6 |
| 45 | South Carolina | 19.5 |
| 46 | South Dakota | 17.3 |
| 47 | Tennessee | 19.8 |
| 48 | Texas | 13.9 |
| 49 | Utah | 13.3 |
| 50 | Vermont | 10.6 |
| 51 | Virginia | 12.8 |
| 53 | Washington | 11.0 |
| 54 | West Virginia | 15.3 |
| 55 | Wisconsin | 12.1 |
| 56 | Wyoming | 23.4 |
Note: Includes gun suicides, gun homicides, and gun deaths that involved law enforcement, were accidental or had undetermined circumstances.
Source: Centers for Disease Control and Prevention.
PEW RESEARCH CENTER
