

Older Americans who live alone tend to fare worse than those who don’t live alone on a variety of measures – from emotional and physical wellbeing to material hardship to overall longevity. They also tend to be less socially engaged and have a lower self-reported quality of life than those living with a spouse or partner.
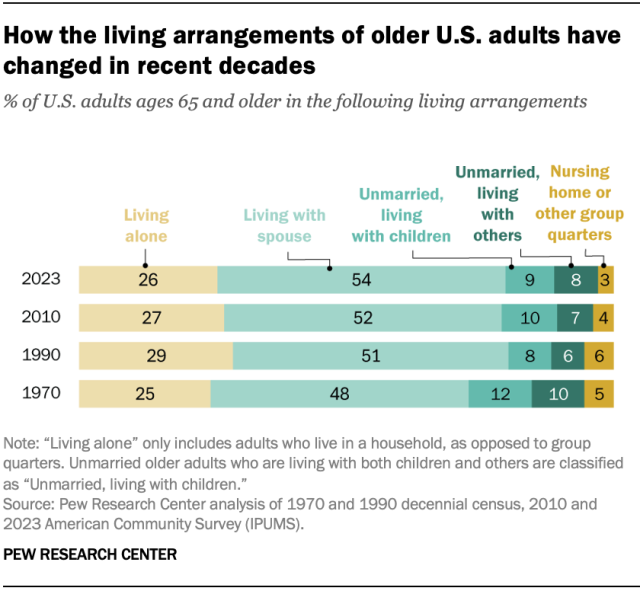
A new Pew Research Center analysis finds that 26% of U.S. adults ages 65 and older lived alone in 2023, the most recent year with available data. That’s down from 29% in 1990.
Meanwhile, a record high 54% of Americans ages 65 and older lived with a spouse in 2023. Another 9% were unmarried and living with one or more of their children, while 8% were unmarried and living with others. A relatively small share (3%) lived in a nursing home or other group quarters.
Here are six important trends in the living arrangements of older Americans, based on our analysis of U.S. Census Bureau data.
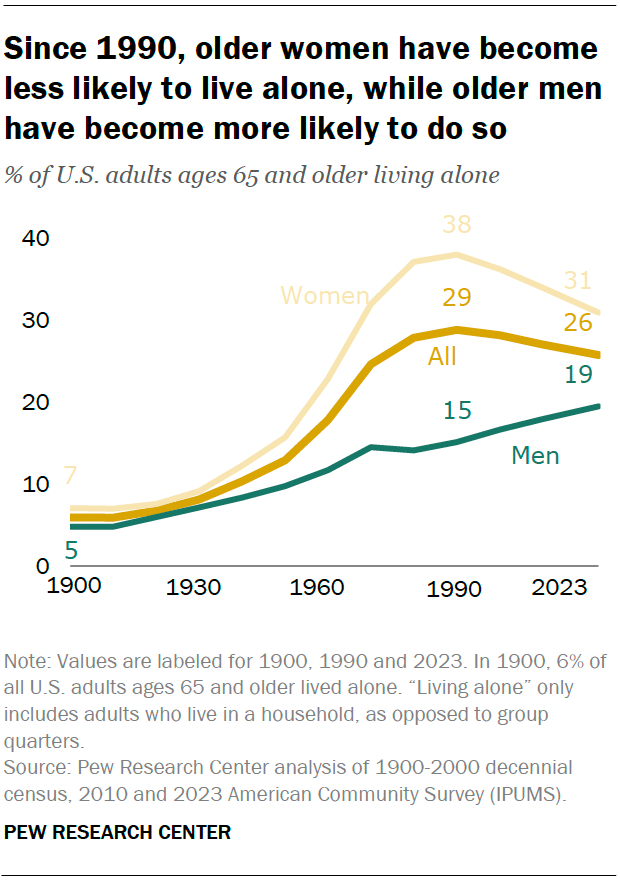
The decline in the share of older U.S. adults living alone since 1990 is entirely due to a decrease among older women. As of 2023, 31% of women ages 65 and older lived alone, down from 38% in 1990. In contrast, men in this age group have become more likely to live alone: 19% did so in 2023, up from 15% in 1990.
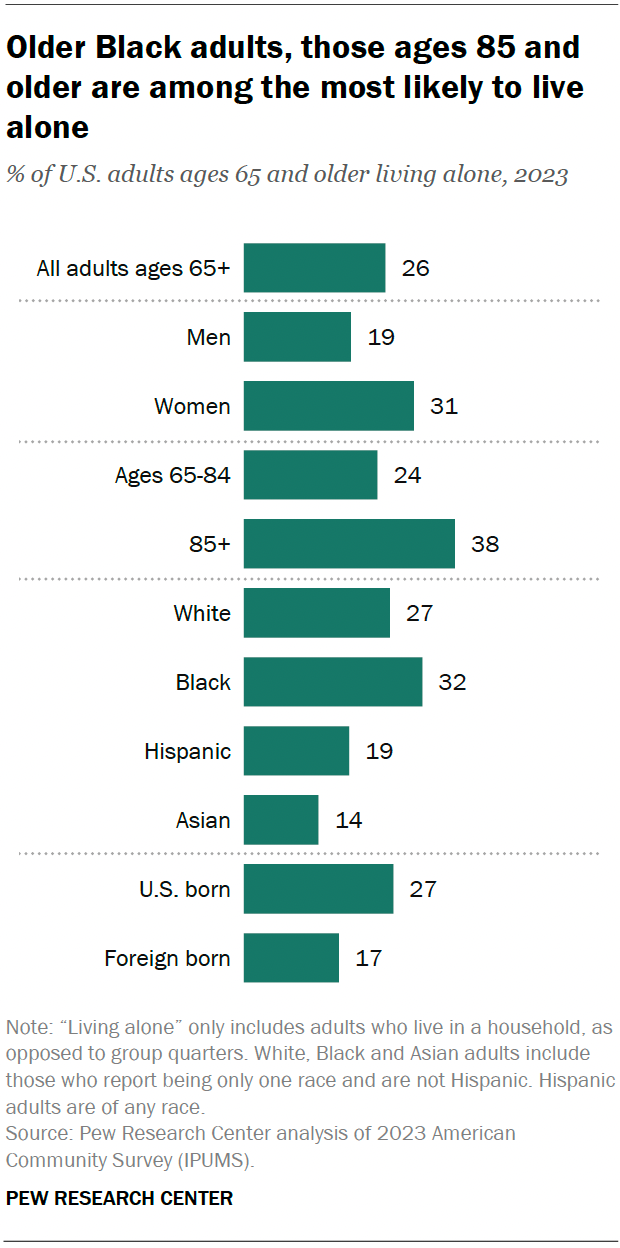
The likelihood of older adults living alone varies across demographic groups. Older women are far more likely than older men to live alone (31% vs. 19%), as are adults ages 85 and older compared with those ages 65 to 84 (38% vs. 24%).
When it comes to race and ethnicity, older Black adults (32%) are more likely than those who are White (27%), Hispanic (19%) or Asian (14%) to live alone.
There are differences by nativity, too. U.S.-born older adults are more likely than foreign-born older adults to live alone (27% vs. 17%).
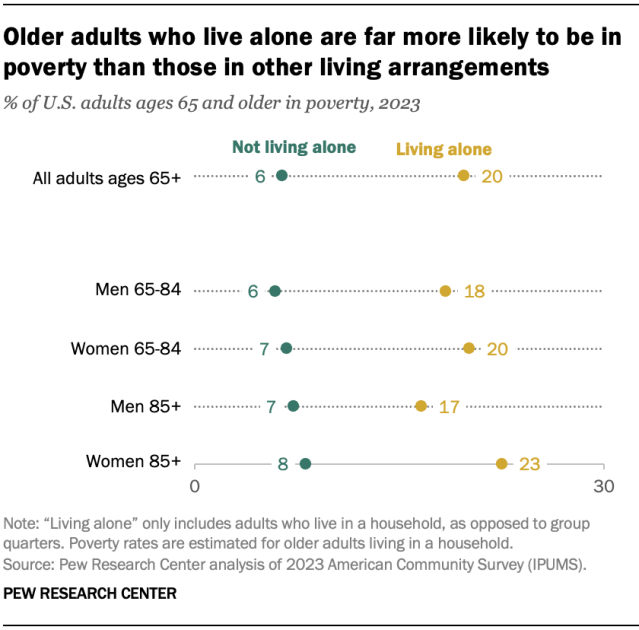
Older adults who live alone are more likely to be in poverty. One-in-five older adults who lived alone in 2023 were in poverty, compared with 6% of older adults who did not live alone.
The government’s official poverty measure varies depending on family size and composition. In 2024, a person age 65 or older who lived alone was in poverty if their income was less than $15,045.
Across gender and age groups, older adults who live alone are more likely than those who don’t live alone to be in poverty. Among adults ages 65 to 84, for example, both women and men who live alone are more likely than those who don’t live alone to be in poverty.
A record share of older adults are married and living with a spouse. The 54% of older adults who live with a spouse is the highest figure in Census Bureau data dating back to 1900.
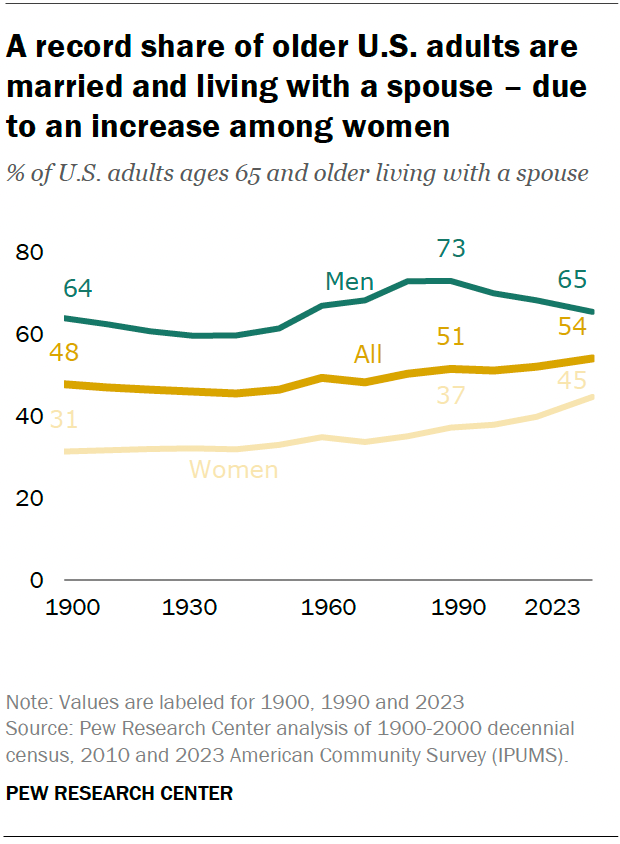
Over the past 30 years, this trend has moved in opposite directions for women and men. Women ages 65 and older are more likely to live with a spouse now than in 1990, while men are less likely to do so. This is primarily because women and men are living longer, and because women are much less likely to be widowed now than in the past.
Older adults are less likely to be living in a nursing home or other group quarters than in the past. Some 3% of adults ages 65 and older were living in this type of setting in 2023, down from 6% in 1990.
The decrease has been particularly striking among those ages 85 and older. As of 2023, 12% of women ages 85 and older were living in a nursing home or other group quarters, down from 27% in 1990. And 7% of men in this age group were living in group quarters in 2023, down from 17% in 1990.
The 2020 U.S. census shows that a broad majority of the adults ages 65 and older who live in group quarters (77%) are in skilled nursing facilities.
The share of older adults in a multigenerational household has risen since 1990.
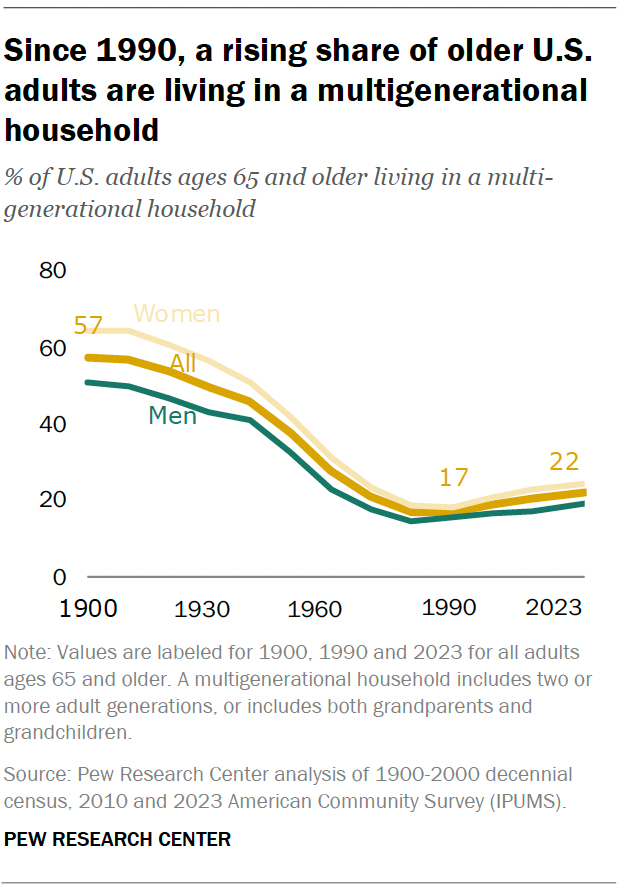
As of 2023, 22% of adults ages 65 and older lived in a multigenerational family household, up from 17% in 1990. The share of older adults living in this type of household fell steadily throughout the 1900s and reached a low point in 1990.
Since then, multigenerational living has grown among all older adults including men and women. But this is especially true for those ages 85 and older: 25% lived in a multigenerational household in 2023, up from 18% in 1990.
Older Americans in this type of living arrangement tend to be unmarried. A 55% majority of those ages 65 and older who live in multigenerational households do not live with a spouse, as of 2023.
And older adults in multigenerational households are less likely than those in other households to be in poverty. This is particularly the case for adults ages 85 and older. Among this group, 7% of those in multigenerational households were living in poverty in 2023, compared with 16% of those in other households.
Note: Senior Demographer Jeffrey Passel contributed to this analysis.
