

Mark Twain once said that “the difference between the almost right word and the right word is really a large matter – ’tis the difference between the lightning-bug and the lightning.” That advice is especially apt when writing about survey data.
For many people, “majority” is a word so common that they rarely have to think twice about what it means. But it’s a different matter for polling organizations like Pew Research Center. By their nature, polls provide an estimate of what a large group of people say, since they’re based on a sample rather than the entire population. This basic reality can create challenges for writers who want to summarize poll findings in a precise way.
To better appreciate the problem, consider these three recent news headlines:
- Majority of Canadians would boycott U.S. in response to trade war
- A majority of travelers are picking destinations based on food
- Majority of Americans approve of Trump’s handling of the economy for the first time
Each headline includes the word “majority.” But take a moment to consider the wide variation in the survey data that’s actually being cited in each of the stories above. In the first article, a “majority of Canadians” refers to 72%. In the second story, “a majority of travelers” refers to 64%. And in the third article, a “majority of Americans” refers to 51%. These differences are substantial.
In order to present survey findings in an accurate and impartial manner in its reports, Pew Research Center has developed internal guidelines for using certain terms consistently. At the Center, writers cannot label a survey finding a “majority” unless it meets specific criteria.
One of these criteria is the survey’s margin of error. Since surveys only question a sample of a larger population that is being studied – whether that population is a single city, an entire country or something else – the margin of error describes the estimated range within which we would expect the exact answer to fall. (The results we would have gotten if we had surveyed everyone in that larger population is the “true population value.”) For example, if a survey has a margin of error of plus or minus 3 percentage points at the 95% confidence level, that means we can expect the result to be within 3 percentage points of the true population value 95 out of 100 times.
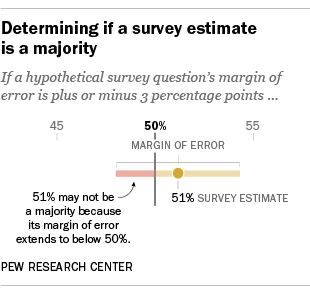
Let’s say our hypothetical survey asks a yes or no question about whether the economy should be the top concern of the country’s political leaders. If 51% of all respondents say “yes,” we would estimate the true population value to fall between 48% and 54%. As such, 51% in this survey would not necessarily translate to a “majority” of Americans. But if 54% say “yes” – again keeping in mind the 3-point margin of error – then we would estimate the true population value to fall between 51% and 57%. Therefore, it would be a fair characterization by our standards to say that a response of 54% or higher is a “majority” share of the population. (The Center’s writing guidelines note, however, that caution is always warranted when you’re close to the threshold.)
It is important to remember that there are several sources of uncertainty in survey estimates, some of which can’t be quantified. For instance, question wording can introduce error or bias into the findings of opinion polls. Another potential source of error is nonresponse bias – that is, when the people who respond to surveys differ in important ways from the people who don’t respond.
Although the Center’s writers can’t quantify all of the uncertainties when summarizing survey data, they seek to acknowledge them. Or, put another away, precise writing requires an accurate description of imprecision.