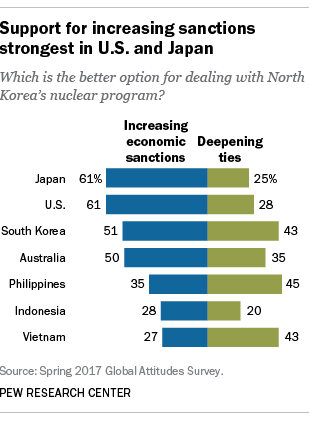
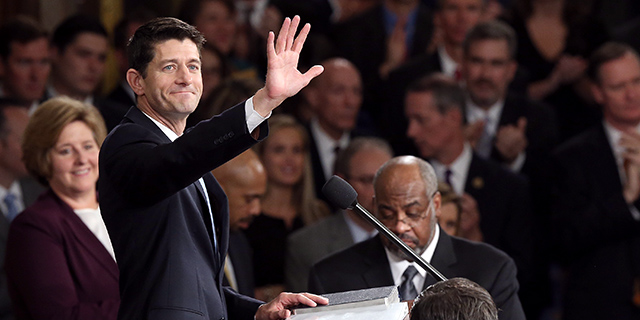
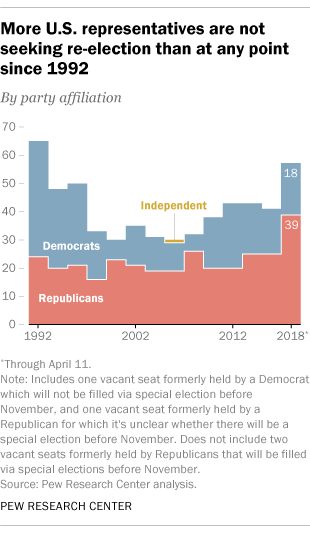
House Speaker Paul Ryan’s announcement Wednesday that he would not seek re-election adds a big name to what was already shaping up to be a near-record year of seat turnovers in the U.S. House of Representatives. More House members are choosing not to run for re-election to that body than at any time in the past quarter-century – including a record number of Republicans, according to a Pew Research Center analysis.
As of April 11, 55 representatives (38 Republicans and 17 Democrats) have announced they’re not running for new terms, according to our count. In addition, one Republican (Blake Farenthold of Texas) and one Democrat (John Conyers of Michigan) have resigned. That makes a total of 57 voluntary departures, or 13% of the House’s full voting membership.
Those counts could rise further, since the filing deadlines in several states haven’t yet passed. Still, the number of retirements so far this year is the most since 1992, when 65 representatives (41 Democrats and 24 Republicans) chose not to pursue re-election; 51 retired outright, while 14 decided to run for some other office. Based on our analysis and a tally going back to 1930 compiled by Vital Statistics on Congress, 1992 is the record year for voluntary House departures.
The 38 Republicans who are leaving the House by choice after this year – including Wisconsin’s Ryan, the speaker since October 2015 – are the most for the GOP since 1930. (This year’s tally doesn’t include two currently vacant seats that had been held by Republicans who have resigned, since those seats will be filled by special elections before November and the winners presumably will seek full terms as incumbents. Conyers’ seat, however, won’t be filled until Election Day in November, and it’s unclear whether there will be a special election for Farenthold’s seat before then.)
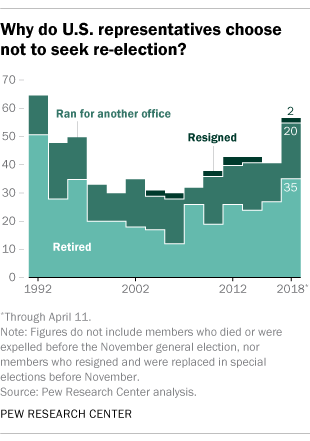
Of the 55 representatives who’ve chosen not to seek re-election to the House this November, 20 are running for other offices instead – 11 for U.S. Senate and nine for governor of their state. (One representative, Maryland Democrat John Delaney, says he’ll run for president in 2020, but that’s a long way off so for now we’re counting him as a straight retirement.) The 35 retirements so far this year are the most since 1996, when the same number of House members left without seeking another office.
For this analysis, we combined several lists of departing House members (such as those from The Atlantic and the House Press Gallery) and verified the names through media reports; we also drew on data for past years that we gathered in 2014. Not included in the count were what might be called “involuntary departures” – where members died or (in one case) were expelled too soon to fill their seats via special election before the November general. (Democrat Louise Slaughter of New York died in March; it’s not clear whether there will be an early special election for her seat.)
At the time of his resignation in December 2017, Conyers was the “dean of the House” – the member with the longest continuous service in that chamber. Conyers served 52.9 years in the House, making him the third-longest-serving representative in U.S. history. Other long-serving members hanging up their spurs this year include Sander Levin, D-Mich. (36 years in the House), Joe Barton and Lamar Smith, both R-Texas (34 and 32 years, respectively), and Jimmy Duncan, R-Tenn. (30.2 years). All told, the 35 retiring members represent 588.6 years of House experience walking out the door (assuming they all complete their current terms).
On average, the retiring members have 16.8 years of House experience (again, assuming they all complete their terms), compared with 7.6 years for the members leaving to seek another office, and an average of 10.7 years for the members seeking re-election. Among all current members, the average tenure among Democrats is 12.7 years, versus 9.7 for Republicans; among the retiring members, tenure averages 15.4 years for Democrats, 17.4 years for Republicans.
The spate of House members opting not to run for re-election this year has prompted much commentary speculating on what it might or might not mean for Democrats’ hopes of regaining control of the chamber. But large numbers of retirements don’t necessarily portend big changes in the House’s partisan makeup, based on a review of election results since 1992.
Over that timespan, there have been three elections that saw enough seats switch parties to shift control of the House. In 1994, a net 52 House seats swung from Democratic to Republican as the GOP took control for the first time in more than four decades. Democrats regained control in 2006, when they picked up 30 Republican seats, only to lose it again in 2010 when a net 63 seats turned from blue to red.
None of those elections were marked by particularly large numbers of voluntary departures. In 1994, 48 representatives chose to leave the House by retiring, resigning (without replacement) or running for some other office – not many more than the 1992-2018 average of 41. Only 30 representatives passed on re-election bids in 2006 (less than 7% of the House), and 38 did so in 2010. On the other hand, while 1992 remains the record year for voluntary departures, the GOP gained just a net 10 seats from Democrats in that year’s elections.
And picking off seats opened up by retirements, resignations or seeking other offices has not been a major factor behind the most recent shifts in House control. In 2010, only 13 of the 66 Democratic seats that flipped to the GOP were open; just seven of the 30 Republican seats that Democrats captured in 2006 to retake the House were open. In 1994, Republicans won 21 open Democratic seats, but it was the 35 Democratic incumbents they beat that gave them the majority.
Note: This is an update to a post originally published on March 1, 2018.
