For the fifth time in U.S. history, and the second time this century, a presidential candidate has won the White House while losing the popular vote.

In this week’s Electoral College balloting, Donald Trump won 304 electoral votes to Hillary Clinton’s 227, with five Democratic and two Republican “faithless electors” voting for other people. That result was despite the fact that Clinton received nearly 2.9 million more popular votes than Trump in November’s election, according to Pew Research Center’s tabulation of state election results. Our tally shows Clinton won 65.8 million votes (48.25%) to almost 63 million (46.15%) for Trump, with minor-party and independent candidates taking the rest.

This mismatch between the electoral and popular votes came about because Trump won several large states (such as Florida, Pennsylvania and Wisconsin) by very narrow margins, gaining all their electoral votes in the process, even as Clinton claimed other large states (such as California, Illinois and New York) by much wider margins. Trump’s share of the popular vote, in fact, was the seventh-smallest winning percentage since 1828, when presidential campaigns began to resemble those of today.

In fact, the very nature of the way the U.S. picks its presidents tends to create a disconnect between the outcome in the Electoral College and the popular vote. The last time a popular-vote loser won the presidency in the Electoral College was, of course, in 2000, when George W. Bush edged out Al Gore 271-266 despite Gore winning some 537,000 more popular votes nationwide. The other electoral-popular vote mismatches came in 1876 and 1888; in all four instances the Democratic nominee ended up the loser. (In the 1824 election, which was contested between rival factions of the old Democratic-Republican Party, Andrew Jackson won a plurality of the popular and electoral vote, but because he was short of an Electoral College majority the election was thrown to the House of Representatives, which chose runner-up John Quincy Adams.)

Even in the vast majority of U.S. elections, in which the same candidate won both the popular and the electoral vote, the system usually makes the winner’s victory margin in the former a lot wider than in the latter. In 2012, for example, Barack Obama won 51% of the nationwide popular vote but nearly 62% of the electoral votes, or 332 out of 538.

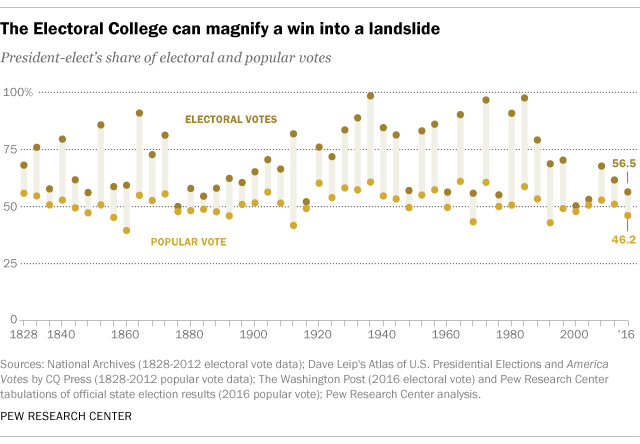
Looking back at all presidential elections since 1828, the winner’s electoral vote share has, on average, been 1.36 times his popular vote share – what we’ll call the electoral vote (EV) inflation factor. Trump’s EV inflation factor, based on his winning 56.5% of the electoral votes (304 out of 538) is 1.22, similar to Obama’s in 2012 (1.21).

A quick Electoral College refresher: The 538 electors allocated (mainly by population) among the 50 states and the District of Columbia actually choose the president and vice president, with a majority of electoral votes (i.e., 270) needed for an outright win. All but two states use a plurality winner-take-all system to pick their presidential electors – whoever receives the most votes in a state wins all of its electoral votes, even if he or she got less than a majority of the popular vote. (Maine and Nebraska award some of their electoral votes by congressional district rather than statewide; that enabled Trump to win one of Maine’s four electoral votes, for the state’s 2nd District, even though Clinton won the state overall.)

The biggest disparity between the winning electoral and popular votes, with an EV inflation factor of 1.96, came in 1912 in the four-way slugfest between Democrat Woodrow Wilson, Republican incumbent William Howard Taft, Progressive Theodore Roosevelt (who had bolted from the Republicans) and Socialist Eugene V. Debs. Wilson won a whopping 82% of the electoral votes – 435 out of 531 – with less than 42% of the overall popular vote. (In fact, Wilson won popular vote majorities in only 11 of the 40 states he carried – all in what was then the solidly Democratic South.)

The next biggest gap was the 1980 “Reagan landslide.” In that three-way contest, Ronald Reagan took just under 51% of the popular vote, to Jimmy Carter’s 41% and independent John Anderson’s 6.6%. But Reagan soared past Carter in the Electoral College: 489 electoral votes (91% of the total) to 49, for an EV inflation factor of 1.79.

Many of the elections with the most-inflated electoral votes featured prominent third-party candidates, who served to hold down the winners’ popular vote share without being significant Electoral College players themselves. On the other hand, when the two major-party nominees ran fairly evenly and there were no notable independents or third parties, the Electoral College vote has tended to be much closer to the popular tally. In 2004, for instance, incumbent Bush won a second term with just under 51% of the popular vote and 53% of the electoral votes (286 out of 538).

A notable feature of the 2016 Electoral College vote was the record number of so-called “faithless electors” – electors who cast their ballots for someone other than the official nominee of the party they’re pledged to represent. The five Democratic electors who voted for people other than Clinton included three from Washington State who chose Colin Powell and another who chose Yankton Sioux tribal elder Faith Spotted Eagle, and one from Hawaii who voted for Vermont Sen. Bernie Sanders, Clinton’s rival in the primaries. In addition, the two Texas electors who spurned Trump voted instead for Ohio Gov. John Kasich (whom Trump had defeated in the primaries) and former U.S. Rep. Ron Paul.

Note: This is an update of a post originally published Nov. 3, 2016.

Topics
ReligionPolitics & PolicyInternational AffairsImmigration & MigrationRace & EthnicityAge & GenerationsGender & LGBTQFamily & RelationshipsEconomy & WorkScienceInternet & TechnologyNews Habits & MediaMethodological ResearchOther TopicsPolitical IssuesU.S. Elections & VotersElection 2020Election 2018Election 2016Election 2014Election 2012Election 2010Election 2008Elections Before 2008Voters & VotingVoter DemographicsVoter ParticipationElection System & Voting ProcessElection NewsWorld ElectionsPolitical Parties & PolarizationPolitical TypologyPolitical DiscoursePolitical & Civic EngagementPolitics & MediaPolitical Ideals & SystemsDemocracyAuthoritarianismCapitalismSocialismCommunismPopulismNationalismPresidential ApprovalDonald TrumpAngela MerkelNarendra ModiVladimir PutinMore LeadersBill ClintonGeorge W. BushBarack ObamaGovernmentTrust in GovernmentSupreme CourtCongressFederal GovernmentMilitary & VeteransNon-U.S. GovernmentsState & Local GovernmentReligion & GovernmentProtests & UprisingsParty IdentificationPolitical AnimosityLeadersDemographics & PoliticsGenerations, Age & PoliticsGender & PoliticsEducation & PoliticsIssue PrioritiesAbortionDeath PenaltyDefense & National SecurityTerrorismWar & International ConflictNuclear WeaponsMilitary & VeteransDiscrimination & PrejudiceDrug PolicyFree Speech & PressGun PolicyHealth PolicyHealth CareMigration IssuesLGBTQ AcceptanceNational ConditionsPrivacy RightsCriminal JusticeDisasters & AccidentsReligion & GovernmentSocial Security & MedicareWorld LeadersWorld ElectionsGlobal Image of CountriesU.S. Global ImageChina Global ImageOrganizations, Alliances & TreatiesEuropean UnionBilateral RelationsInternational IssuesEnvironment & ClimateGlobal Economy & TradeInternational TerrorismNuclear WeaponsInternational TechnologyImmigration AttitudesImmigration IssuesIntegration & IdentityImmigration & Language AdoptionCitizenshipFamily ReunificationLegal ImmigrationRefugees & Asylum SeekersImmigration & EconomyHigh-Skilled ImmigrationVisas & EmploymentRemittancesRacial Bias & DiscriminationSegregationRace RelationsRacial & Ethnic IdentityRacial & Ethnic ShiftsRacial IntermarriageRace, Ethnicity & PoliticsRacial & Ethnic GroupsBlack AmericansAsian AmericansHispanics/LatinosHispanic/Latino DemographicsHispanics/Latinos & LanguageHispanics/Latinos & EducationHispanics/Latinos & IncomeHispanic/Latino IdentityHispanic/Latino VotersWhitesMore Racial & Ethnic GroupsReligious Identity & AffiliationBeliefs & PracticesInterreligious RelationsReligion & Social ValuesReligion & AbortionBiotechReligion & Death PenaltyReligion & LGBTQ AcceptanceReligious Freedom & RestrictionsNon-Religion & SecularismReligious Leaders & InstitutionsReligion & GovernmentReligion & PoliticsInternational Religious Freedom & RestrictionsReligious DemographicsGlobal Religious DemographicsReligion & ScienceKnowledge & EducationReligionsChristianityCatholicismOrthodox ChristianityProtestantismEvangelicalismPentecostalismMainline ProtestantismHistorically Black ProtestantismMormonismJudaismIslamMuslim AmericansMuslims Around the WorldBuddhismHinduismOther ReligionsReligiously UnaffiliatedComparison of ReligionsGenerationsGeneration ZMillennialsGeneration XBaby BoomersSilent GenerationGreatest GenerationComparison of GenerationsAgeTeens & YouthOlder Adults & AgingComparison of Age GroupsGender & PoliticsEconomics, Work & GenderGender Pay GapGender & LeadershipEducation & GenderGender RolesMotherhood & FatherhoodGender Equality & DiscriminationSexual Misconduct & HarassmentLGBTQ Attitudes & ExperiencesGender IdentitySame-Sex MarriageHousehold Structure & Family RolesFamily CaregivingMarriage & DivorceDivorceIntermarriageSame-Sex MarriageUnmarried AdultsParenthoodFertilityRomance & DatingFriendshipsEconomic ConditionsIncome, Wealth & PovertyBusiness & WorkplaceEconomic PolicyEconomic SystemsPersonal FinancesIncome & WagesEconomic InequalityPovertyWealthHomeownership & RentingMiddle ClassFuture of WorkEmployee BenefitsUnemploymentGender & WorkGig & Sharing EconomiesGovernment Spending & the DeficitGlobal TradeRemittancesStudent LoansRetirementBirth Rate & FertilityGenderTrust in ScienceScience News & InformationSTEM Education & WorkforceReligion & ScienceScience Funding & PolicyScience IssuesScience KnowledgeGene EditingClimate, Energy & EnvironmentFood ScienceHuman EnhancementMedicine & HealthSpaceVaccinesEnergyTechnology AdoptionDigital DivideTechnology Policy IssuesPolitics OnlineDigital News LandscapeLifestyle & Relationships OnlineEducation & Learning OnlineHealthcare OnlineOnline Privacy & SecurityNet NeutralityOnline Harassment & BullyingMisinformation OnlineTech CompaniesOnline ActivismCivic Activities OnlineOnline DatingSocial Relations & TechStresses & Distraction OnlineUser DemographicsTeens & TechChildren & TechOlder Adults & TechRacial & Ethnic Groups OnlineRural Residents & TechGender & TechEmerging TechnologyFuture of the Internet (Project)Artificial IntelligenceAlgorithmsAutomationBotsGig & Sharing EconomiesInternet of ThingsPlatforms & ServicesInternet ConnectivitySocial MediaMobileEntertainmentMore Platforms & ServicesFacebookTwitter (X)SmartphonesAppsTextingVideoGamingMusicOnline SearchE-CommerceEmailBlogsE-ReadingMedia & SocietyNews Media TrendsPolitics & MediaMedia AttitudesMisinformationFreedom of the PressNews KnowledgeMedia IndustryNews Platforms & SourcesDigital News LandscapeLocal NewsNews CoverageNews Content AnalysisMedia PolarizationElection NewsPresidents & PressTrust, Facts & DemocracyTrust in MediaFacts & Fact CheckingBots & MisinformationAmerican News Pathways 2020 ProjectState of the News Media (Project)TelevisionNewspapersAudio, Radio & PodcastsNews Audience DemographicsSocial Media & the NewsData ScienceDemographic ResearchAmerican Trends PanelInternational Survey MethodsSurvey MethodsTelephone SurveysNonprobability SurveysVoter FilesEducationLibrariesPersonal LifePublic KnowledgeOccupational GroupsMilitary & VeteransPoliceJournalistsHappiness & Life SatisfactionTime UseLifestyleDeath & DyingK-12Higher EducationStudent LoansElection 2004Election 2006Election 2002Unauthorized ImmigrationImmigration TrendsCOVID-19 & PoliticsAtheism & AgnosticismJoe BidenImmigrant PopulationsBorder Security & EnforcementTechnology & ImmigrationGender & ReligionYounger AdultsTaxesAge, Generations & TechBroadbandMedia Layoffs & EmploymentReligious Knowledge & EducationEducational AttainmentInternational Political ValuesOnline Random Sample SurveysScientists' ViewsJournalistsPoliceWar & International ConflictGlobal Tech & CybersecurityRace, Ethnicity & PoliticsReligious ExtremismU.S. Religious DemographicsCOVID-19 & ScienceReligious TypologyReligious CommitmentPope FrancisPope Benedict XVIPope John Paul IIGlobal HealthRecessions & RecoveriesGovernment Spending & the DeficitUnemploymentReligion & BioethicsYouTubeHuman RightsGlobal Balance of PowerReligion & PoliticsCoronavirus (COVID-19)CyberattacksOnline SurveysU.S. CensusEducation & Learning OnlineLeisureCOVID-19 & the EconomyCOVID-19 in the NewsSurvey BasicsResearch ExplainersInstagramEvolutionSize & Demographic Characteristics of Religious GroupsReligious Characteristics of Demographic GroupsNATOUnited NationsCOVID-19 & TechnologyRural, Urban and Suburban CommunitiesUnionsPew-Templeton Global Religious Futures ProjectElection 2022Israel Global ImageQualitative ResearchTestPartisanship & IssuesPolitical PolarizationU.S. DemocracyPolitical Parties
Drew DeSilver  is a senior writer at Pew Research Center.