
More than 57.6 million people, or 28.5% of estimated eligible voters, voted in the Republican and Democratic presidential primaries that all but wrapped up Tuesday – close to but not quite at the record participation level set in 2008.
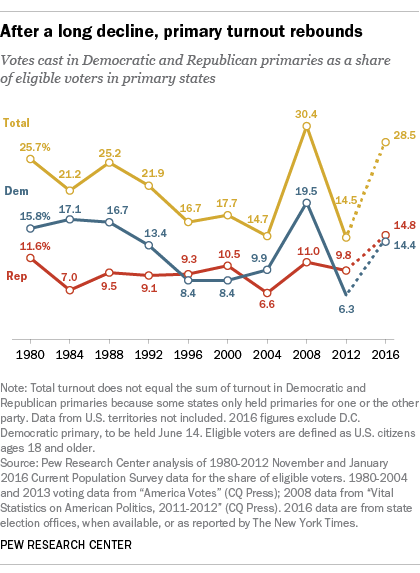
For a while it looked like this year’s primaries, driven by high turnout on the Republican side, might eclipse the turnout record set in 2008, when 30.4% of voting-age citizens cast ballots. The GOP did indeed have the highest primary turnout since at least 1980, according to our analysis – 14.8%, compared with 11% in 2008 and 9.8% in 2012. But turnout fell off markedly after Donald Trump won the May 3 Indiana primary and his two main rivals dropped out of the race.
Turnout in the first 29 GOP primaries – up to and including Indiana – averaged 16.6%, according to our analysis. But turnout in the final nine contests, after Trump became the presumptive Republican nominee, averaged only 8.4%.
By contrast, the heated battle between Hillary Clinton and Bernie Sanders engaged Democratic voters for longer. Less than a day before the final five states held their primaries, the Associated Press reported that Clinton already had clinched the nomination. But turnout in the five primaries held June 7 didn’t appear to be affected, averaging 14.1% compared with an average of 14.5% for the preceding 31 contests. (The District of Columbia will hold its Democratic primary June 14, but there likely won’t be enough voters there to significantly change the nationwide numbers.)
The overall Democratic turnout of 14.4% was well below the record 19.5% in 2008, but it was still the second-highest since 1988’s primary season.
All told, 39 states held primaries for one or both major parties this year (38 Republican and 37 Democratic, including next week’s D.C. primary), with the remaining states using caucuses or conventions to select national party delegates. For each primary state, we calculated turnout by dividing the number of votes reported cast in the party primaries by the estimated number of voting-age citizens (derived from our analysis of Current Population Survey data). We began with 1980, because primaries didn’t become a significant part of the nominating process until after 1968 and available turnout data for 1972 and population data for 1976 were incomplete.
A few caveats: We didn’t try to measure turnout in caucus states, because caucus attendance isn’t always reliably recorded and reported. Puerto Rico did hold Republican and Democratic primaries (the other U.S. territories held caucuses), but we didn’t calculate turnout because the CPS doesn’t include Puerto Rico.
Also, because states don’t always hold both Democratic and Republican primaries, the turnout rates for the two parties individually may not equal total turnout. In most states, total turnout was calculated as the total number of votes cast in the Republican and Democratic primaries divided by the estimated voting-eligible population; in states that held only one party primary, the vote in that primary was used to calculate turnout.
