
Nearly three-quarters of Americans see global climate change as a “very serious” (45%) or “somewhat serious” (29%) threat, and two-thirds (66%) say people will have to make major changes in the way they live to reduce the effects of climate change, according to a Pew Research Center report released earlier this month.
People have received all sorts of advice over the past few decades about how to reduce their climate impact – from driving less to recycling more to insulating their homes. Actual changes in behavior, though, have been very much a mixed bag.
Using the Environmental Protection Agency’s climate change website for suggestions on ways people can reduce greenhouse gas emissions, we analyzed available data to gauge the extent to which Americans are heeding advice on living more climate-friendly lives. Among the indicators we looked at, actual changes ranged from significant to minimal to nonexistent. Here’s what we learned:
Cars and driving:
One of the EPA’s top recommendations is to “purchase a fuel-efficient, low-greenhouse gas vehicle.” Overall fuel economy has, in fact, improved: The sales-weighted average for new vehicles was 25 miles per gallon last month, up from 20.1 mpg in October 2007, according to research by the University of Michigan’s Transportation Research Institute. But average fuel economy has been mostly flat for the past three years, in contrast to steady growth in the late 2000s and early 2010s.
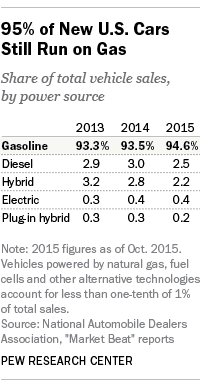
And American drivers are showing few signs of shifting away from fossil fuels. Fewer than 3% of the cars, SUVs, pickups and other “light-duty” vehicles sold through October of this year ran on anything other than gasoline or diesel – an even smaller market share for alternative-fueled vehicles than in 2013 or 2014, according to data from the National Automobile Dealers Association.
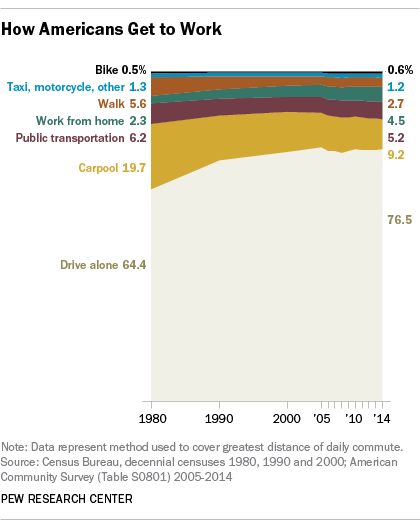
The EPA also suggests that people consider carpooling, mass transit, working from home or other alternatives to driving to and from work solo. But driving alone remains by far the most common commuting method: About three-quarters of Americans reported last year that that was their main commuting mode, a figure that’s changed little since 2000. (The share of solo-driving commuters actually has increased since 1980.)
The percentage of commuters who carpool has fallen by more than half, from 19.7% in 1980 to 9.2% last year. Also, a modest increase in telecommuting hasn’t been enough to make solo driving any less dominant.
Americans are, however, driving less than they used to. Based on our analysis of Federal Highway Administration data on licensed drivers and total vehicle miles traveled, the average driver drove just over 14,000 miles in 2013 – more than he or she did in 1989 (12,700) but slightly less than in the peak years of 2004-05 (14,900). In recent years, the licensed-driver share of the population has edged lower: to 84.6% of Americans aged 16 and over in 2013, after peaking at 88.9% in 1999.
In the home:
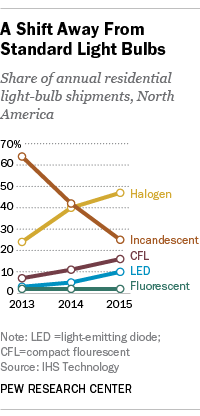
One of the most dramatic shifts in recent years has been the rapid decline of the once-ubiquitous incandescent light bulb. Since the phase-out of standard incandescent bulbs began in 2012, their share of the residential light-bulb market has fallen dramatically: just 25% of total shipments so far this year, down from nearly two-thirds just two years ago, according to market-research firm IHS. Instead, people are buying more energy-efficient and longer-lasting alternatives, such as halogen and LED bulbs.
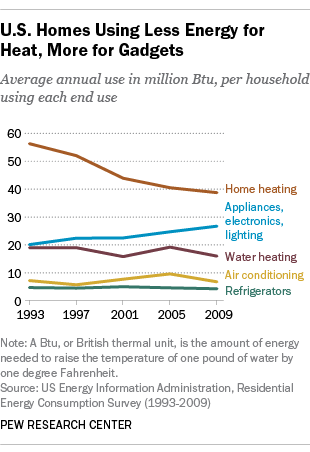
The light-bulb switch is mandated by law, but the government also is encouraging Americans to voluntarily use energy more efficiently at home. Although the most recent Residential Energy Consumption Survey was conducted back in 2009 (the Energy Information Administration has begun collecting 2015 data and expects to begin posting results sometime next year), some trends were apparent even then. The average household used nearly a third less energy for heating their home in 2009 than in 1993, and 16% less for water heating, while use levels for air conditioning and refrigerators stayed roughly the same. But energy used for other appliances, electronics and lighting climbed steadily, rising by about a third between 1993 and 2009.
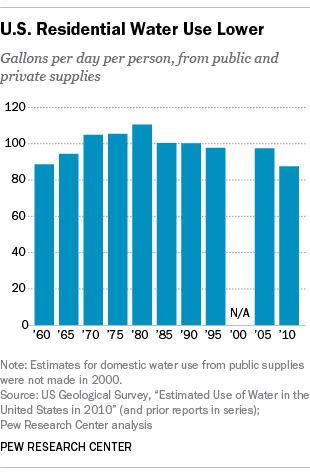
Americans also are using less water in their homes, which indirectly addresses climate change. (As the EPA notes, “It takes lots of energy to pump, treat, and heat water, so saving water reduces greenhouse gas emissions.”) According to our analysis of data from the U.S. Geological Survey, average residential water use was 87.5 gallons per person per day in 2010 (the latest year for which data are available). That’s nearly 21% below the average use figure for 1980, the peak year.
Taking out the trash:
The EPA encourages people to “reduce, reuse and recycle,” noting that doing so “helps conserve energy and reduces pollution and greenhouse gas emissions from resource extraction, manufacturing, and disposal.” But the agency’s own data indicates that the overall recovery rate (from recycling, composting and other processes) has nearly plateaued, following strong growth in the 1980s and 1990s and slower but steady growth through the 2000s. In 2012, about 34.5% of all municipal solid waste generated was recycled, composted or otherwise recovered.
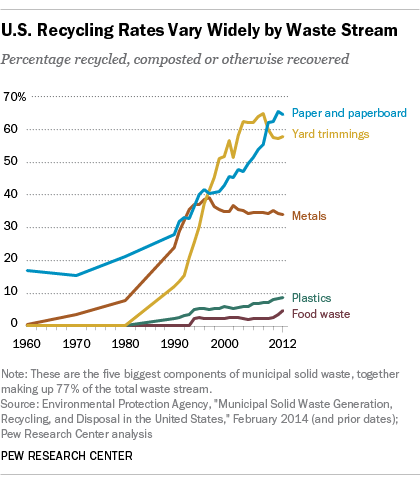
Nearly two-thirds of paper and paperboard, the single biggest category of municipal solid waste, was recovered in 2012, as was nearly 58% of yard trimmings, the third-biggest category. But less than 5% of food waste – the second-biggest category, with more than 36 million tons generated annually – was composted or otherwise recovered. And only 8.8% of plastic waste, nearly 32 million tons of which was generated in 2012, was recycled or otherwise recovered.
To be fair, Americans are generating less waste than they did just a few years ago, and less of it is ending up in landfills or elsewhere. In 2012, the average American generated 4.38 pounds of waste per day, 2.36 pounds of which was ultimately disposed of, according to our analysis of EPA data. Those figures were down from 4.69 pounds and 2.63 pounds, respectively, in 2005.
