As an industry, political organizations – comprising political action committees (PACs) and campaign organizations, among other political clubs – take their cues not from stock markets, but from the quadrennial election cycle. They emerge like pop-up shops ahead of Election Day, and are hastily disassembled shortly thereafter.
We were curious whether, as an industry, political organizations have been growing — in terms of wages and sheer numbers. It turns out, there’s been a steady increase in both.
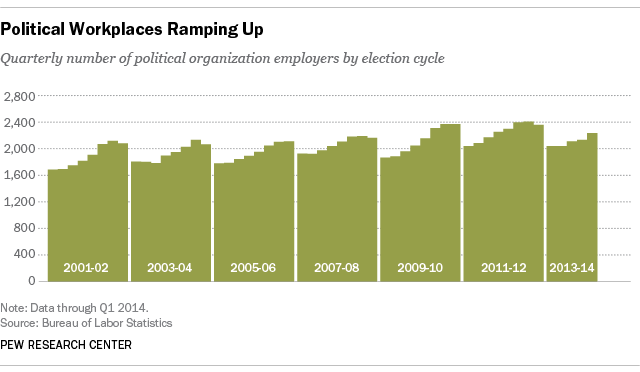
Looking back to 1980, when Ronald Reagan ran against Jimmy Carter, there were 1,275 political organizations. In 2012, there were 2,365. But as you would expect, those numbers ebb and flow when broken down by the even-numbered election years and odd-numbered off years. Since 1978, there have been on average 1,810 political organizations in presidential election years and 1,743 political organizations in midterm years. In off years, that number falls to 1,575, according to the Bureau of Labor Statistics’ Quarterly Census of Employment and Wages.
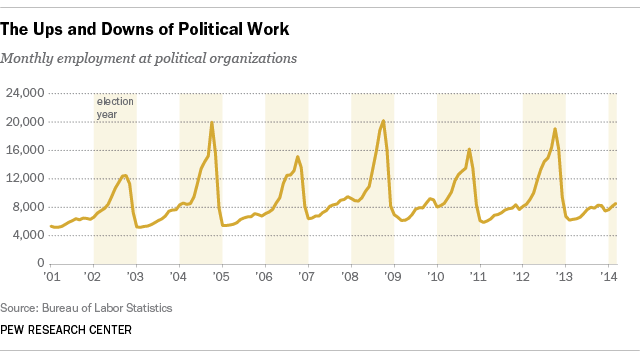
While many political workers already live nomadic lives, given the on-the-job demands of the campaign trail, their employment statuses can be similarly in flux. Looking at monthly data going back to 2001, the number employed at political organizations during presidential and midterm election years peaks in October (with 19,754 and 14,607 respectively employed on average) and plummets thereafter (with 8,505 and 7,907 employed on average in December). By contrast, there are on average 6,839 employees of political organizations during off years.
For example, the number of political workers employed topped out at 20,207 in October 2008, during the home stretch of the Obama-McCain race, and dropped to less than half that number — just 8,177 in December, following the November elections.
(Those counts of paid political workers don’t include the millions of unpaid campaign volunteers, who, ahead of the 2014 midterms, made up some 5% of registered voters, according to an Oct. 15-20 Pew Research survey.)
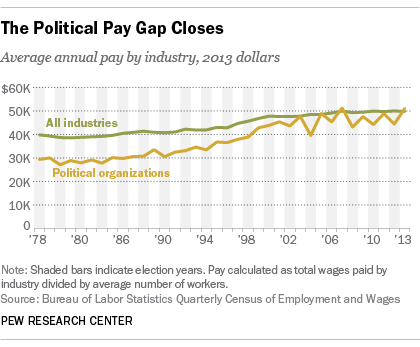
Over time, the data show that workers at political organizations are making more than they used to. On average, workers in this category made $51,000 in 2013, 76% more than the $29,000 in inflation-adjusted dollars they made in 1978.
In 2013, political workers were paid slightly more than what the average U.S. workers were paid (just under $50,000). But that hasn’t always been the case: In 1978, political workers earned considerably less than the average worker.
The pay for workers at political organizations also has begun fluctuating over the past decade, with off-year pay being slightly higher than election-year pay. In 2011, the average annual pay was $49,000. In 2012, that figure dropped to $44,000, before rising again to $51,000 in 2013.