
One of the big questions about any election, including this year’s midterm, is who turned out to vote and who did not. Pollsters, journalists and politicians carefully want to examine the racial and ethnic demographics of the electorate. For example, how many Latinos voted? How many blacks and whites voted, and how do those shares compare with turnout in previous elections?
These questions aren’t easy to answer because the two primary sources that provide insight into voter demographics — the National Election Pool’s Exit Poll and the U.S. Census Bureau’s Current Population Survey — use different methodologies, are released at different times, and often produce slightly different results.
Analysts on election night typically use the national exit poll for a first look at how a variety of demographic groups voted, including by gender, age, education, income and race and ethnicity. For example, the 2010 national exit poll showed that 60% of whites voted Republican in House races nationwide, while strong majorities of blacks (89%) and Latinos (60%) voted Democratic. The national exit poll consists of interviews with people as they leave their polling place (and telephone surveys of early voters). It is conducted by the polling firm Edison Media Research and is paid for by a consortium of news media outlets. This year, there will be exit polls for the national House of Representatives vote and some key U.S. Senate and governor races.
Exit polls also estimate the share of various demographic groups among voters nationwide and in key states. For example, in the 2010 midterms, exit polls found that non-Hispanic whites accounted for 77% of voters nationwide in House races, while an estimated 11% were black and 8% were Latinos.
By contrast, the Census Bureau data have estimated a lower share of Hispanic voters compared with the national exit poll, at least in the previous two midterm elections. Unlike the national exit poll, the Census Bureau’s survey is not conducted on election eve, but in the weeks following the election. It is also part of a larger survey about the labor market experiences of Americans. Final results related to the election are not released until the following spring — which is less useful for the news media eager for minute-by-minute information on election night.
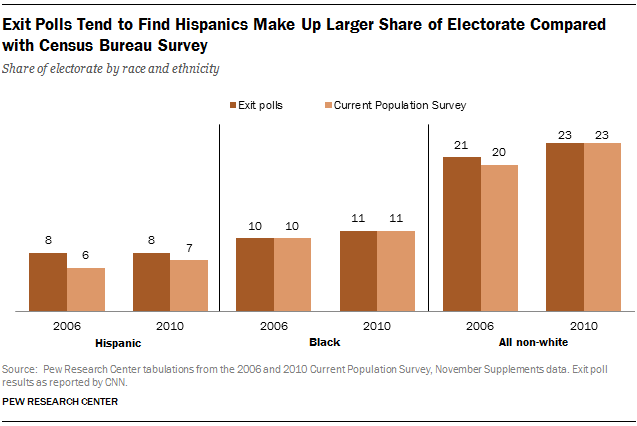
In 2006, the national exit poll estimated that Hispanics made up 8% of the national electorate in House races, while the Census Bureau’s survey estimated the share was 6% — a gap of two percentage points. In 2010, the national exit poll again estimated Hispanics making up 8% of voters, while the Census Bureau’s survey put the share at 7% — a smaller gap of one percentage point. There’s a similar pattern for the estimated Hispanic share in recent presidential elections. In 2012, exit polls estimated the Hispanic share of voters at 10%, but the estimate from the Census Bureau survey was 8%.
There are a number of reasons for these differences. For example, exit polls adjust their data to actual vote totals as they become available. Often it takes hours for states and local election officials to report how many people voted and which candidates they supported. The national exit poll is adjusted to these results hours after the polls have closed. This can cause results reported by the exit poll to change significantly over the course of election night as more votes are tallied and reported. In addition, the selection of precincts where exit polls are conducted may impact the demographic composition of voters estimated by the exit poll.
The exit poll is a survey, just like any other, and has a margin of error. The margin of error grows when examining smaller demographic groups, such as Hispanics or other race groups, both in terms of how a group voted and its estimated share of the electorate. In 2004, for example, a Pew Research Center analysis of exit poll data in conjunction with Current Population Survey data suggested that President George W. Bush took 40% of the Hispanic vote rather than the 44% originally reported in the exit poll. Some of this difference was attributed to how certain precincts in Florida were sampled.
Despite its release more than six months after the election, the Census Bureau survey benefits from a larger sample size compared with the national exit poll. In 2010, the Census Bureau survey had a sample size of about 95,000 respondents, compared with more than 17,000 for the national exit poll. But the Census Bureau data also have their limitations. For example, respondents are asked to self-report whether they voted, and the Census Bureau does not verify responses with actual voting records. In addition, the survey doesn’t ask respondents which candidate they voted for.

