
On Tuesday the Census Bureau released its annual trove of data on income, poverty and health insurance in 2012. Here were some of the key findings on household income:

New data show that median household income has stagnated for the longest period since the government began collecting such data in 1967.
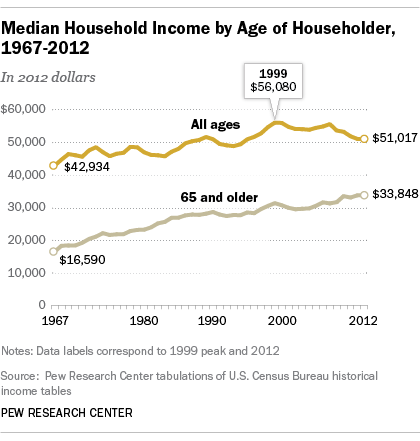
In 2012 the median household income was $51,017, still below the pre-recession 2007 level ($55,627) and also below the all-time peak level reached in 1999 ($56,080). So the typical American household had 9% less income in 2012 than it did 13 years earlier (all figures adjusted for inflation). The 2012 level is just above where it had stood as of 1995 ($50,978).

Households headed by those 65 and older are faring relatively better since the recession.
The income patterns of younger and older households have moved in opposite directions in recent years. The median incomes of households headed by those 65 and older have risen during the recession and recovery, continuing their steady rise over more than four decades. By contrast, the median incomes of younger and middle-aged households have declined since the onset of the recession. In 2012, the median household income among those led by someone aged 65 and older was $33,848, statistically unchanged from $33,810 in 2011. Thus, in 2012 the median household income of seniors was 66% of the national median household income. Back in 1967, the median income of these older households was only 39% of the national median.

The income gaps between racial and ethnic groups have stayed pretty much the same in recent years.
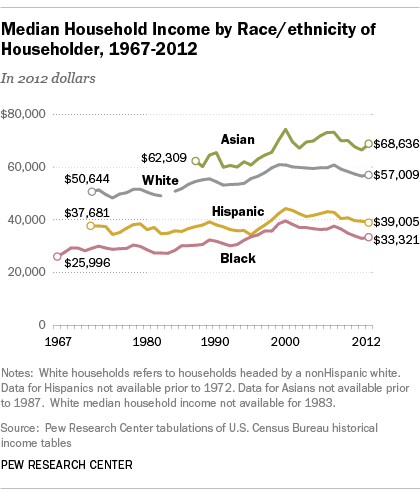
The median household incomes of white, black, Hispanic and Asian households did not statistically change from 2011 to 2012.
As the recent Pew Research report on Martin Luther King Jr.’s elusive dream noted, the gap in median income between white and black households has not changed much over the decades. In 1972, white incomes were 1.7 times black incomes. White and black incomes have both risen since then and in 2012 white incomes were 1.7 times black incomes. The white-to-Hispanic income gap has risen since 1972, from 1.3 in 1972 to 1.5 in 2012. The Census Bureau has tracked Asian household incomes since 1987. In 1987 white incomes were about 88% of the typical Asian household. By 2012, whites incomes were 83% of Asian incomes. These household income figures from the Census are not adjusted for variance in household size. Asian-Americans tend to have more people living in their households than do other race groups, which may account for some of the gap in median income.

The income gap continues to widen within the total U.S. population, and also within each racial/ethnic groups.
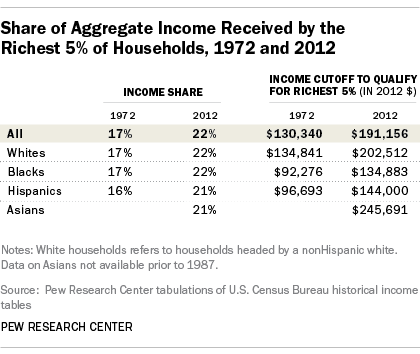
Household income growth has been greater among better-off households than for lower income households. For example, household income for households in the middle (median household income) increased 19% from 1967 to 2012. But the threshold to qualify for the richest 5% of households increased 67% since 1967 from $114,203 to $191,156 in 2012.
The nation’s higher income households have received a growing share of a growing aggregate household income pie. In 1967 the top 5% received 17% of the income pie, compared to 22% in 2012.
Just as income inequality has increased for the population as a whole, disparities within each racial/ethnic group have also widened over the past few decades. For example, in 2012, the richest 5% of black households (those with incomes of at least $134,883) received 22% of aggregate black household income, up from 17% in 1972. The share of income of the top 5% of white and Hispanic households have shown similar increases from 1972 to 2012.
