Given the continuing campaigns by unions, workers, politicians and others to raise the federal minimum wage, it bears asking: Just who are minimum-wage workers, anyway?
Perhaps surprisingly, not very many people earn minimum wage, and they make up a smaller share of the workforce than they used to. According to the Bureau of Labor Statistics, last year 1.532 million hourly workers earned the federal minimum of $7.25 an hour; nearly 1.8 million more earned less than that because they fell under one of several exemptions (tipped employees, full-time students, certain disabled workers and others), for a total of 3.3 million hourly workers at or below the federal minimum.
That group represents 4.3% of the nation’s 75.9 million hourly-paid workers and 2.6% of all wage and salary workers. In 1979, when the BLS began regularly studying minimum-wage workers, they represented 13.4% of hourly workers and 7.9% of all wage and salary workers. (Bear in mind that the 3.3 million figure doesn’t include salaried workers, although BLS says relatively few salaried workers are paid at what would translate into below-minimum hourly rates. Also, 23 states, as well as the District of Columbia, have higher minimum wages than the federal standard; people who earned the state minimum wage in those jurisdictions aren’t included in the 3.3 million total.)
People at or below the federal minimum are:
- Disproportionately young: 50.4% are ages 16 to 24; 24% are teenagers (ages 16 to 19).
- Mostly (77%) white; nearly half are white women.
- Largely part-time workers (64% of the total).
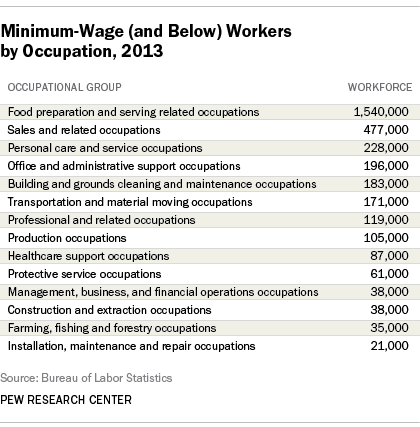
They’re employed in the industries and occupations you might expect: More than half (55%) work in the leisure and hospitality industry, about 14% in retail, 8% in education and health services, and the rest scattered among other industries. Broken down occupationally, the picture is similar: Nearly 47% are in food-preparation and serving-related occupations; 14.5% are in sales and related occupations, 7% in personal care and service occupations, and the rest are scattered.
They’re also more likely to live in the South than anywhere else – in part because only one southern state (Florida) has its own higher state minimum wage. In both the West South Central (Texas, Oklahoma, Arkansas and Louisiana) and East South Central (Alabama, Kentucky, Mississippi and Tennessee) regions, 6.3% of hourly workers make the federal minimum or less — the highest rates among the nine Census Bureau-defined regions. They were followed by the eight-state (plus D.C.) South Atlantic region, where 5.1% of hourly workers made the federal minimum or less. The lowest rate, 1.5%, was in the Pacific region – not surprising, given that four of the five states in that region (California, Oregon, Washington and Alaska) have their own, higher state minimums.
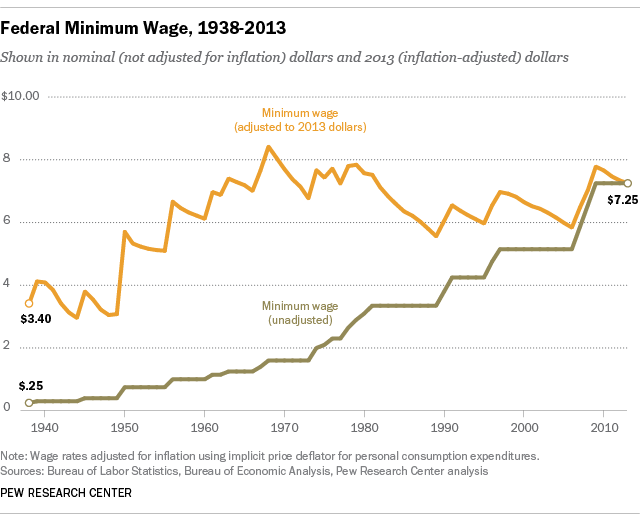
Economists continue to debate the extent to which minimum-wage laws reduce poverty, income inequality and/or overall employment. What’s clear, though, is that after a three-step increase in 2007-09, today’s minimum wage buys more than it did recently, but its real purchasing power is about where it was in the early 1980s — and below its late-1960s peak.
Note: This post has been updated with 2013 data.
