by Shirin Hakimzadeh, Pew Hispanic Center
This has been a notable year for Hispanics in the United States. The large-scale immigration rallies in the spring and the policy debate over immigration drew the attention of the American public — as well as a wider global audience — to the social, legal and economic complexities often associated with a population group that is both growing and changing very quickly. So, where do Hispanics in the U.S. stand and where are they headed?
The Pew Hispanic Center’s Statistical Portrait of Hispanics at Mid-Decade offers a detailed look at a range of social, economic and housing characteristics tabulated from a new Census Bureau data source. The American Community Survey, fully implemented for the first time in 2005, now draws on a yearly sample of about three million addresses, making it by far the largest household survey in the United States. Previously, demographic data on this scale was only available once every 10 years when a full census was conducted.
The statistical profile, in the form of 32 tables, highlights the ever-increasing importance of chronicling Hispanic trends longitudinally as well as according to differences in place of origin, nativity, age and gender. Understanding the internal diversity of the Latino population is proving indispensable to any assessment of its current status and most certainly its future in the latter half of the decade or beyond.
Population by Race and Ethnicity: 2000 and 2005
Universe: 2000 and 2005 Household Population

Note: “Other, not Hispanic” includes persons reporting single races not listed separately and those reporting more than one race
Source: Pew Hispanic Center tabulations of 2000 Census and 2005 American Community Survey
The 2005 ACS marked the Hispanic population at 41.9 million people, an increase of 22% over 2000. More strikingly, Hispanics account for half of the total population growth in the U.S. over the last five years. The impact of Latino population growth is further magnified by the fact that the white and black populations have grown by only 2% and 7% respectively since 2000.
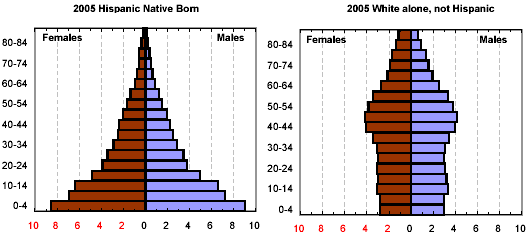
The demographic impact of this rapid growth is further magnified by Latino’s youth. While the white age structure is relatively top heavy, with many older people at the top and fewer young at the base, the Hispanic population has a broader base and narrows toward the top. According to the 2005 data, the median age of Hispanics in the U.S. is 27 — considerably lower than 40, the median age for whites.
Masked behind the median age of the total population lies a notable variation between native-born versus foreign-born Hispanics. While half of native-born Hispanics are currently 17 years old or younger, half of foreign-born Hispanics are 35 years old or younger, significantly closer the age distribution of whites.
Population Pyramids by Ethnicity: 2005
Universe: 2000 and 2005 Household Population

Note: X-axis represents percent of group total
Source: Pew Hispanic Center tabulations of 2005 American Community Survey
The 2005 data confirm that Latino population growth has been driven primarily by increases in the second generation. Over the last five years, native-born Hispanics accounted for 62% of the total change in the Hispanic population, while foreign-born Hispanics represented the remaining 38%. In 2005, the 25 million native-born Hispanics in the U.S. represent just less than 60% of all Hispanics.
The boom in the second generation is attributable to high fertility rates. In 2005, Hispanics accounted for one out of every five women giving birth in the U.S. Among foreign-born Hispanic women nearly 11% gave birth in the year prior to the 2005 survey compared with 6% of white, 7% of black, and 8% of native-born Hispanic women.
Because of their youthful age structure and high fertility rates, Hispanics will continue to have a major impact on U.S. school systems. Currently, 9.6 million Hispanic children are enrolled in grades K-12, representing an increase of 1.3 million since 2000. Hispanic children account for 19% of all K-12 students and 17% of all nursery school children. In contrast, the number of white children enrolled in grades K-12 decreased by 1.8 million between 2000 and 2005, bringing their share of total K-12 enrollment just below 60%.
It becomes especially important to distinguish between native-born and foreign-born Hispanics when analyzing educational attainment. Three out of every four native-born Hispanic adults have finished high school, in contrast to less than half of foreign-born adults. Despite steady progress in educational attainment among native-born Hispanics, there remain large disparities between Hispanic adults and white adults, 89% of whom are high school graduates.
Educational differences among the foreign-born and native-born translate into marked differences with respect to occupation groups as well. While the largest share of native-born Hispanics (18%) participate in office and administrative support occupations, the largest share of foreign-born Hispanics (16%) are in construction trades.
Likewise, the median household income among native-born Hispanics is $39,000, representing a $5,000 increase over foreign-born households. Collectively, U.S. Hispanics reported a median household income of $36,000 in 2005, compared with $50,000 for whites, $30,000 for blacks, and $59,000 for Asians.
Though sharing elements of Latin American ancestry and culture, Hispanics in the U.S. trace their origins to many countries. In 2005, 64% of the total Hispanic population was of Mexican origin, followed by significantly smaller populations of Puerto Ricans (9%), Cubans (4%), and Dominicans (3%).
Some Hispanics speak only English, others only Spanish, and many are bilingual. In 2005, according to the survey, 80% of Hispanics under age 18 said they spoke English very well, while 53% over age 18 claimed a similar level of English ability. Focusing on the immigrant population, among the Hispanic foreign born over age 18, nearly three out of every four said they speak English less than very well. If the sample is limited to the foreign born over age 18 who arrived in the U.S. before 1990, 63% claimed to speak English less than very well.
The 2005 data further validate the well-noted fact that as the US Hispanic population grows numerically, it also spreads geographically. The five states with the largest Hispanic population in 2005 were California, Texas, Florida, New York and Illinois, respectively. However, the states with the fastest growth between 2000 and 2005 were North Dakota, Arkansas, South Carolina, Tennessee, and North Carolina. In the last five years alone, North Dakota experienced a 62% increase in its Hispanic population. Taken together with the slight decreases evident in the share of Hispanics in many traditional receiving states, the most recent data attest to a continued dispersion of Hispanics.
Where will Hispanics go from here? Will they continue to account for such a large share of the total population growth in the U.S., or will they eventually reach a point of stabilization? And what role will the Hispanic youth who are filing in behind the baby boomers play in the years to come?
Though the portrait of Hispanics at mid-decade undoubtedly depicts a population in flux, the frame of this portrait is by no means fixed. Rather, in the latter half of this decade, and for several decades to come, Hispanics will continue not only to transform the U.S., but also to be transformed in an ongoing process of mutual adaptation.
See complete Statistical Portrait of Hispanics at Mid-Decade
Note: The words Latino and Hispanic are used interchangeably. The terms white and black refer to non-Hispanics.


