
This section examines the demographic profile of lesbian, gay, bisexual and transgender adults surveyed by the Pew Research Center and other prominent research organizations. It also discusses the challenges involved in collecting data on the size and characteristics of a population that can be defined several different ways and whose members may be reluctant to disclose their sexual orientation and gender identity in a survey interview or questionnaire because of perceived stigma.
As shown in the table below, different surveys yield broad similarities but also some notable differences in the characteristics, geographic location and political affiliation of this population. As explained later in this section, both the means of determining sexual orientation and gender identity and the mode of questionnaire administration can significantly affect results and may explain the variances. No single set of findings should be deemed authoritative; all should be taken as estimates.
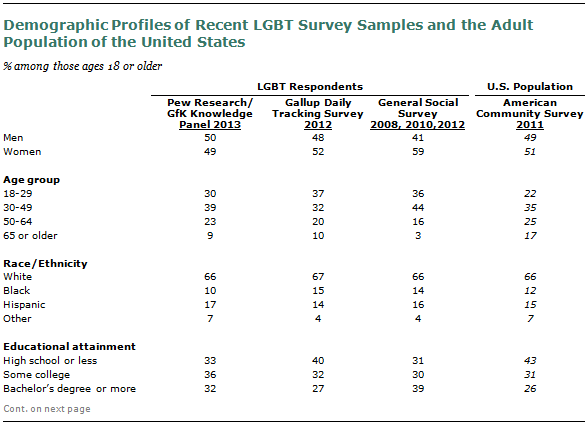
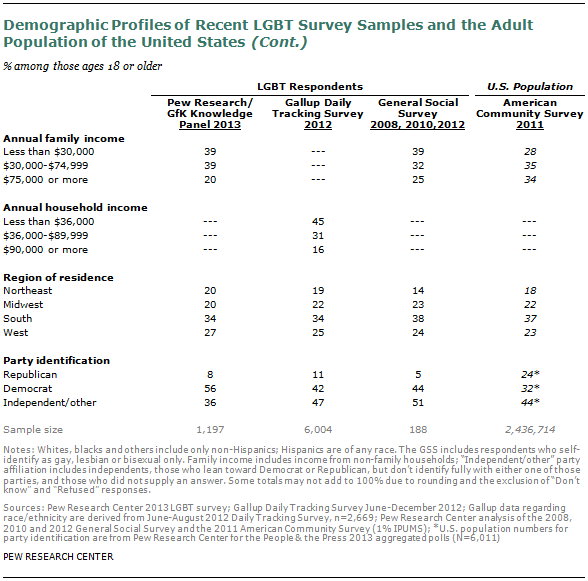
Comparing Survey Respondent Demographics
Results from the 2013 Pew Research Center LGBT survey, as well as the Gallup 2012 and General Social Surveys (GSS), all indicate that LGBT respondents are generally younger than the overall adult population. The Pew Research survey suggests that they have more education than the total adult population. And all three survey sources indicate that they have lower family or household incomes (which is likely due, in part, to their younger ages and the fact that fewer live in family households, which tend to have higher incomes than other households). The LGBT respondents and the overall adult population share fairly similar profiles in terms of gender composition, race/ethnicity, and region of residence.
Among respondents to the Pew Research Center LGBT survey, 30% are ages 18 to 29, higher than the 22% share of this age group among all adults, according to the Census Bureau’s 2011 American Community Survey. In the 2012 Gallup LGBT survey sample, extracted from the Gallup daily tracking poll in 2012, 37% of respondents are ages 18 to 29.
In terms of educational attainment, 32% of Pew Research LGBT respondents have a bachelor’s degree or more, compared with 26% of the U.S. adult population and 27% of Gallup LGBT respondents. Among Pew Research LGBT respondents, a third (33%) have a high school education or less, compared with 43% of the adult population and 40% of Gallup LGBT respondents.
In financial terms, 39% of LGBT respondents have annual family incomes of less than $30,000, compared with just 28% of adults overall. (Gallup respondents were asked about monthly income, and the offered categories do not permit direct comparison with Pew Research data or other sources.)
Data from the General Social Survey (GSS) are also shown in the table. The GSS is a biennial survey conducted by the National Opinion Research Center (NORC). The survey includes a question asking whether a respondent identifies as gay, lesbian, homosexual, bisexual, straight or heterosexual, and the majority of responses are collected via in-person interviews.
Challenges in Studying the LGBT Population
In the Pew Research Center survey, sexuality and gender identity are based upon self-identity. Respondents are asked whether they consider themselves to be heterosexual, gay, lesbian or bisexual; in a separate question, they are asked whether they consider themselves to be transgender. In some other studies, researchers categorize respondents’ sexuality based upon whether they report ever being attracted to same-sex or opposite-sex persons.
Another means of categorizing sexuality is based upon behavior—whether, for example, a respondent ever had sexual relations with a same-sex person and/or an opposite-sex person. Adding a layer of complexity to this method is the time dimension. Researchers might choose to classify an individual based on a single sexual relationship many years ago, based only on a pattern of recent sexual activity or based on something in between (Gates 2012).
These different approaches yield different results. A 2011 review of various survey findings indicated that while an estimated 3.5% of respondents self-identified as gay, lesbian or bisexual, 8.2% reported having engaged in same-sex behaviors, and 11% of respondents (ages 18 to 44) reported at least some level of attraction to people of the same sex (Gates 2011).
A related issue is the possible unwillingness of some LGBT individuals to reveal their status in a survey interview. Given that there are mixed public attitudes about less common forms of sexual orientation and gender identity, respondents may worry about the consequences of disclosing their LGBT status. Consequently, surveys may understate the LGBT share of the population and be biased because different kinds of LGBT individuals may be more or less willing to disclose their status. For example, many studies show that younger people are more likely than older adults to self-identify as LGBT. This may reflect real differences but could also reflect a greater willingness of younger people to disclose their sexual orientation.
Because of the stigma that some attach to LGBT status, collecting information on this population group may be especially sensitive to the mode of interview used. Results from a face-to-face or telephone interview may underestimate the size of the LGBT population, if some respondents do not feel comfortable disclosing such information to others. A self-administered questionnaire, as was used in the 2013 Pew Research Center LGBT Survey, typically produces a higher share of respondents who disclose that they are LGBT (Gates 2011).
Results from two large national surveys illustrate this discrepancy. The National Election Pool’s 2012 exit poll, conducted among voters on Election Day using self-administered paper questionnaires and in telephone surveys among those who voted early and absentee, found 5% of voters identifying as gay, lesbian or bisexual. Gallup’s Daily Tracking telephone surveys aggregated from June to December 2012 finds 3.5% of respondents identifying as LGBT. These estimates are lower than that among 2012 voters; the difference may be partially related to the fact that the Gallup survey is conducted entirely by telephone interviewers, while most of the interviews in the exit poll are self-administered and thus anonymous.
Census Data on Same-Sex Couples and Opposite-Sex Couples Living Together
 Another source of data on this population comes from the Census Bureau, which publishes counts and characteristics of same-sex couples. This measure does not cover the full gay and lesbian population because it does not tabulate unpartnered gay men or lesbians, as well as people who consider themselves to be in same-sex couples but who do not live together.
Nearly 650,000 same-sex couple households were counted in the 2010 Census (O’Connell and Feliz, 2011).5 They included nearly 515,000 unmarried-partner couples and nearly 132,000 couples who identified themselves as married.6
The Census Bureau statistics on same-sex couples, both in the decennial count and the annual American Community Survey,7 come from a question that asks how other members of the household are related to the householder. Among the response categories are “husband/wife” and “unmarried partner.” If a householder is linked to another household member who has one of these relationship classifications, and that person is of the same sex as the householder, the two are deemed a same-sex couple. This measure, therefore, does not capture the small share of cohabiting same-sex couples where neither member of the couple is the householder.
About half (51%) of same-sex couples in the 2011 American Community Survey8 were female, a change from 2005 when the majority were male, according to an analysis comparing same-sex and opposite-sex couples (Gates, 2013a). The same analysis reported that the share of same-sex couples with at least one partner ages 65 and older had increased to 9.7% in 2011, from 7.5% in 2005.
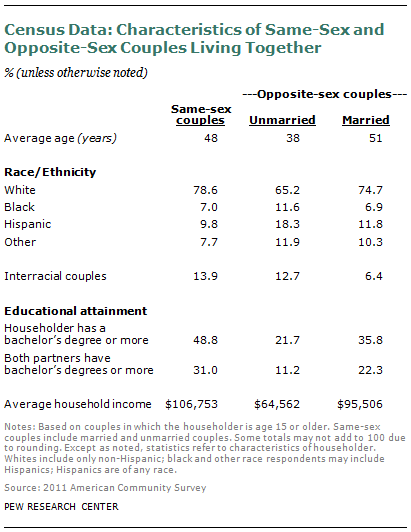
Same-sex couples on average fall between opposite-sex married and unmarried couples on the age spectrum, according to a Census Bureau comparison of same-sex and opposite-sex couples in the 2011 American Community Survey (Census Bureau 2012). The average age of the householder was 47.7 years for same-sex couples, compared with 51.3 for opposite-sex married couples and 38.3 for opposite-sex unmarried couples.
While 12.6% of same-sex couple households include a household head ages 65 and older, this share is 20% for opposite-sex married couples and 4.6% for opposite-sex unmarried couples. Similarly, 20.4% of same-sex couple households include a household head who is younger than 35, compared with 15% of opposite-sex married couples and 48.5% of unmarried opposite-sex couples.
The share of same-sex couple householders who are non-Hispanic white (78.6%) is the same or slightly higher than the share of opposite-sex married couple householders (74.7%) and higher than the share of unmarried opposite-sex couple householders (65.2%). The share of black householders (including black Hispanics) among same-sex couples (7%) is similar to the share among married opposite-sex couples (6.9%), but this share is lower than among unmarried opposite-sex couples (11.6%). Hispanic householders are also less prevalent among same-sex couples (9.8%) than among married opposite-sex couples (11.8%) or unmarried opposite-sex couples (18.3%).
Same-sex couples (13.9%) are at least as likely as opposite-sex unmarried couples (12.7%) to have partners of different races, and more so than opposite-sex married couples (6.4%).
Same-sex couples are more likely than opposite-sex couples to include at least one college-educated partner. According to 2011 American Community Survey data, 48.8% of householders in same-sex couples have college degrees, and in 31% of those couples, both partners have at least a college education. For opposite-sex married couples, 35.8% of householders have college degrees, and in 22.3% of marriages, both spouses do. For opposite-sex unmarried couples, 21.7% of householders have college degrees and in 11.2% of couples, both partners do.
The average household income in 2011 of same-sex couples is higher than those in both opposite-sex married and unmarried couples. Same-sex couples bring in an average of $107,000 a year, compared with $96,000 for opposite-sex married couples and $65,000 for opposite-sex unmarried couples.
Their higher income probably reflects the high educational attainment of same-sex couples, but also their greater likelihood (compared with opposite-sex married couples) of being in a two-worker household. Both partners are employed in 58% of same-sex couples, compared with 47.2% of opposite-sex married couples and 54.7% of opposite-sex unmarried couples.
Counting Same-Sex Couples in the Census and ACS
The 1990 Census was the first to include an “unmarried partner” relationship category, which allowed for a count of same-sex couples living together. Since that time, the number of same-sex couples living together has grown markedly. However, the Census Bureau cautions against comparing totals from earlier counts with more current ones. There are a number of reasons it’s difficult to gauge the increasing share of same-sex couple households—among them, the changing acceptability of homosexuality; issues with data collection; and changes in the way the Census Bureau edits the data.
As with other types of surveys, some people may not disclose their living arrangements, due to perceived stigma associated with homosexuality or fear of discrimination. They may report their relationship to the household head as a “roommate” instead of as an “unmarried partner” or “husband/wife,” for example. Since public acceptance of same-sex couples has been increasing in recent years, and since the Census Bureau has improved its outreach to the LGBT population (Cohn 2011), the likelihood of same-sex couples who live together accurately reporting this fact probably has increased.
Accidental misreporting may also occur in the data collection process. For instance, after analyzing 2010 Census data, bureau officials reported that the initial tally of same-sex couples was likely an overcount, in part because of a poorly designed questionnaire that caused some people to be assigned the wrong gender. The original count had more than 900,000 same-sex couples; the bureau released a new “preferred” lower count of 646,464 and promised that improvements in upcoming surveys would raise the quality of the data about same-sex couples.9
With any survey, problems can arise after data collection. And even relatively minor coding errors can have a big impact on results for small populations like same-sex couples. Since the 1990 introduction of the same-sex couple option on the decennial Census (and later on the ACS), a number of issues have arisen in the editing of the data. For instance, in the 1990 Census data, if a household’s census form listed a married same-sex couple, the Census Bureau changed the gender of one of the spouses on the assumption that an error had been made (because at that time, same-sex marriage was not legal).
Family Profiles from Past Surveys and Census Data
There are marked differences between same-sex and opposite-sex couples when it comes to the presence of children under age 18 in the household, according to the Census Bureau. About four-in-ten opposite-sex married couples (40.7%) and unmarried couples (41.8%) have children younger than 18 living with them. But that is true of only 17.5% of same-sex couples (11% of male couples and 23.2% of female couples).
Both the 2012 Gallup Survey and the General Social Survey extracted similar information for individuals, based upon their own definition of their sexuality and gender identity. In the case of the Gallup Survey, among LGBT respondents in the prime child-rearing ages (up to age 50) about 35% reported that they had a child under age 18 in the home. The comparable number among non-LGBT adults is 70%. (Gates 2013b). The 2008 and 2010 General Social Surveys include parenthood status based upon reported children ever born. Results indicate that among gay, lesbian and bisexual adults, more than one-third (37%) have had a child; due to the way the question was worded, these are most likely biological children.
In the Pew Research survey, more than one-third (35%) of LGBT respondents report that they are the parent or guardian of a child, and 17% report that they are the parent or guardian of a child under age 18. Bisexual respondents (52%) are much more likely than lesbians (31%) or gay men (16%) to be parents.
References
Cohn, D’Vera. 2011. “How Accurate Are Counts of Same-Sex Couples?” Washington, DC: Pew Research Center, August.
O’Connell, Martin, and Sarah Feliz. 2011. “Same-sex Couple Household Statistics from the 2010 Census.” SEHSD working paper 2011-26. Washington, DC: U.S. Census Bureau.
Gates, Gary J. 2013a. “Same Sex and Different Sex Couples in the American Community Survey: 2005-2011.” Los Angeles, CA: Williams Institute at UCLA School of Law, February.
Gates, Gary J. 2013b. “LGBT Parenting in the United States.” Los Angeles, CA: Williams Institute at UCLA School of Law, February.
Gates, Gary J., and Frank Newport. 2013c. “LBGT Percentage Highest in D.C., Lowest in North Dakota.” Princeton, NJ: Gallup, February.
Gates, Gary J. 2012. “LGBT Identity: A Demographer’s Perspective.” Los Angeles, CA: Loyola of Los Angeles Law Review, March.
Gates, Gary J. 2011. “How many people are lesbian, gay bisexual and transgender?” Los Angeles, CA: The Williams Institute at UCLA School of Law, April.
U.S. Census Bureau. “Table 1. Household Characteristics of Opposite-Sex and Same-Sex Couple Households: ACS 2011.” Washington, DC: 2012.


