Many public school teachers in the United States are dissatisfied with their pay. That may help explain why a sizable share of them have a second job – and not just in the summertime.
For the 2020-21 school year – the most recent year with available data – 16% of full-time public elementary and secondary school teachers in the U.S. worked a nonschool job over the summer. A similar share (17%) did so during the school year, according to data from the National Center for Education Statistics (NCES).
These shares are much higher than the 4.6% of all U.S. workers ages 20 and older who worked multiple jobs in 2020 and 2021, according to Bureau of Labor Statistics (BLS) averages.
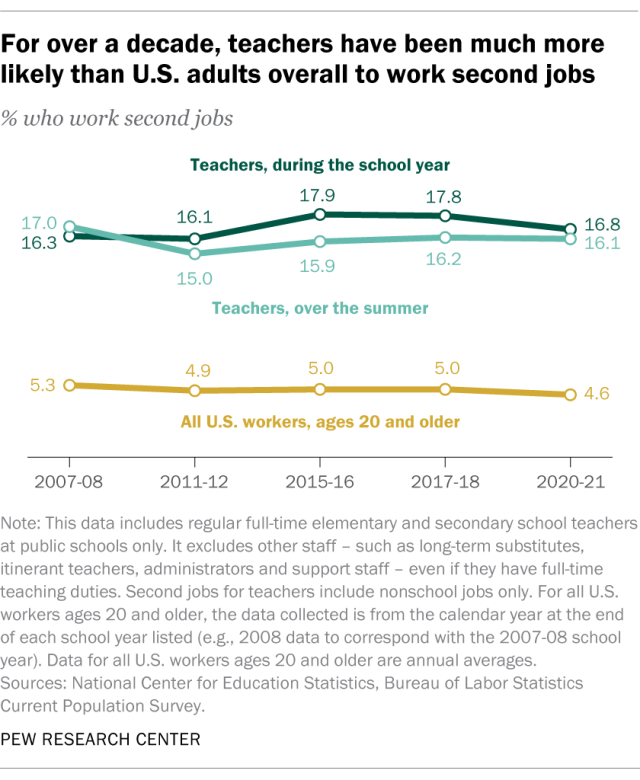
The 2020-21 school year was during the COVID-19 pandemic, which upended many aspects of teachers’ jobs. However, the share of teachers working second jobs outside the classroom did not change much from before the pandemic. During the 2017-18 year, 16% of teachers worked nonschool jobs over the summer and 18% did so during the school year.
In fact, these shares have remained relatively consistent – and much higher than the shares for all U.S. workers ages 20 and older – since at least 2007-08, the first year that NCES tracked summer employment separately.
Which teachers are most likely to work second jobs in the summer and during the school year?
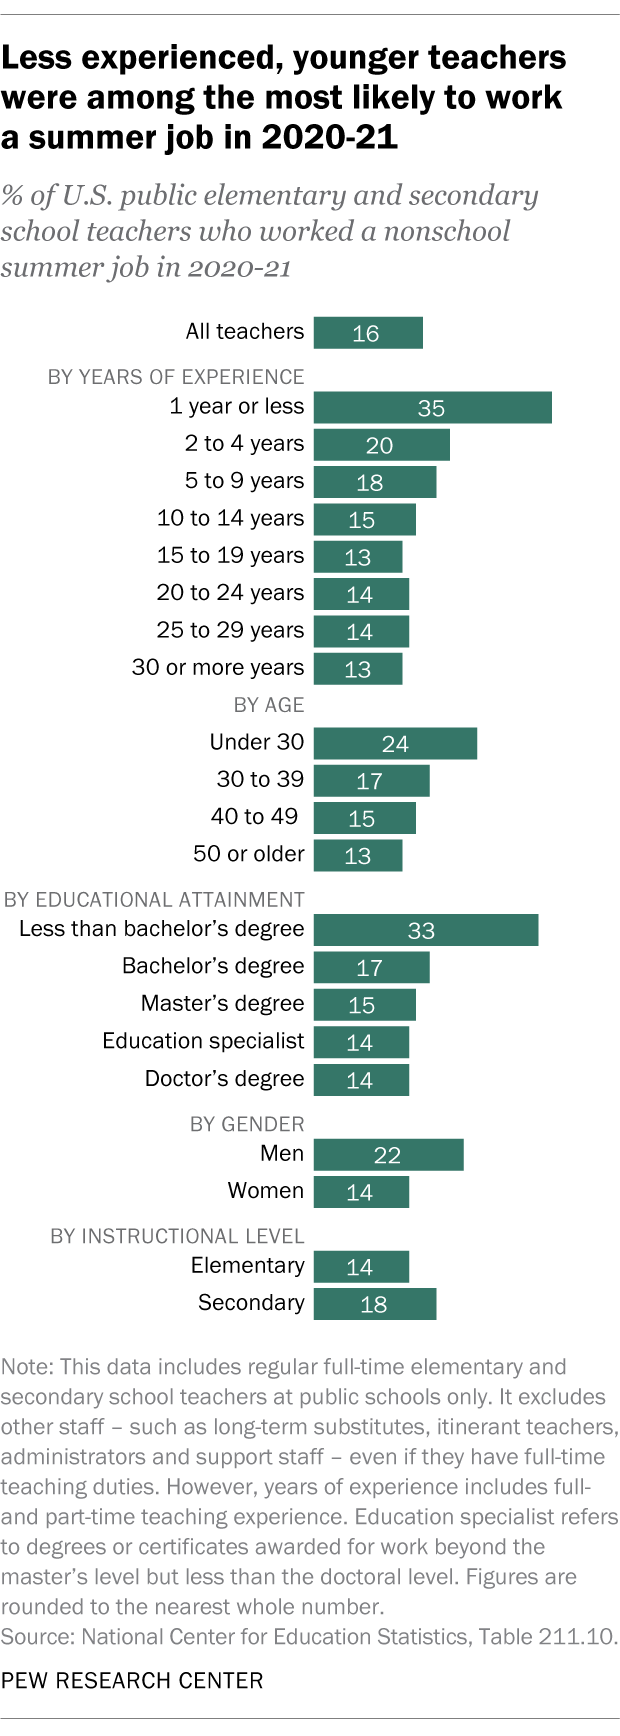
Certain groups of teachers were more likely than others to work summer jobs outside the school system in 2020-21. These included teachers with less experience, younger teachers and teachers who do not have a bachelor’s degree. These groups generally had lower base salaries, on average, than their more experienced, older and more educated counterparts.
For example, 35% of teachers with one year of experience or less worked a nonschool job in the summer. That share dropped to 20% among those with two to four years of experience and to 13% among those with 30 or more years of experience.
Male teachers were also more likely than female teachers to work summer jobs (22% vs. 14%). And secondary school teachers were slightly more likely than elementary school teachers to do this (18% vs. 14%).
When it comes to working second jobs during the school year, the youngest and least experienced teachers were about as likely as older and more experienced teachers to do so in 2020-21. But there were still some groups who were more likely than others to do this:
- Teachers without a bachelor’s degree
- Male teachers
- Secondary school teachers
Notably, the gender differences in teachers working second jobs diverge from the pattern for U.S. workers overall. In both 2020 and 2021, women ages 20 and older were slightly more likely than men in the same age group to work second jobs, on average, according to BLS data.
How much do teachers earn from nonschool jobs?
On average, teachers earned $3,550 in 2020-21 from nonschool summer jobs, or about 5% of their average total annual income. They earned more, on average, from nonschool jobs during the school year: about $6,090, or 9% of their income.
Earnings from second jobs, whether during the summer or the school year, tended to make up a slightly larger share of teachers’ total income for those with less experience and those with less education. For example, nonschool summer jobs brought in 12% of total income, on average, in 2020-21 for teachers who didn’t have a bachelor’s degree. For teachers whose highest degree was a bachelor’s, that share was 6%.
Dissatisfaction with pay is common among teachers
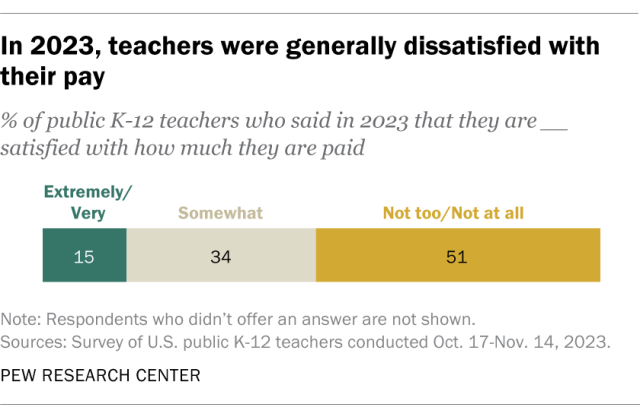
In a 2023 Pew Research Center survey, 51% of public school K-12 teachers said they were not too or not at all satisfied with how much they were paid. Another 34% were somewhat satisfied with their pay, and just 15% were extremely or very satisfied.
Americans overall generally think teachers should earn more. In a separate 2023 survey, 74% of U.S. adults said teachers should be paid more, including 39% who said they should be paid a lot more.
