As in past years, Americans view their state and local governments far more positively than the federal government in Washington. But favorability ratings of all three levels of government have taken a downturn from a few years ago.
Pew Research Center included these questions about federal, state and local governments as part of a larger survey on how Americans view different levels of government. For this analysis, we surveyed 5,203 adults from Nov. 27 to Dec. 3, 2023.
Everyone who took part in this survey is a member of the Center’s American Trends Panel (ATP), an online survey panel that is recruited through national, random sampling of residential addresses. This way nearly all U.S. adults have a chance of selection. The survey is weighted to be representative of the U.S. adult population by gender, race, ethnicity, partisan affiliation, education and other categories. Read more about the ATP’s methodology.
Here are the questions used for the report and its methodology.
Our December 2023 survey of 5,203 adults finds:
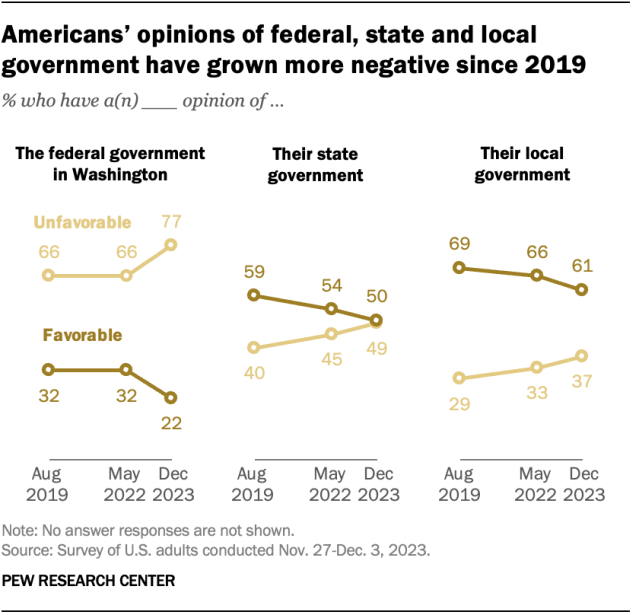
- Just 22% of U.S. adults have a favorable opinion of the federal government, down 10 percentage points since 2022.
- State governments get mixed ratings: 50% of adults have a favorable opinion and 49% have an unfavorable view. This reflects a 4-point decline in favorability since 2022 and a 9-point decline since 2019.
- 61% of adults rate their local government positively. But this, too, is down from 66% in 2022 and 69% in 2019.
Opinions of the federal government
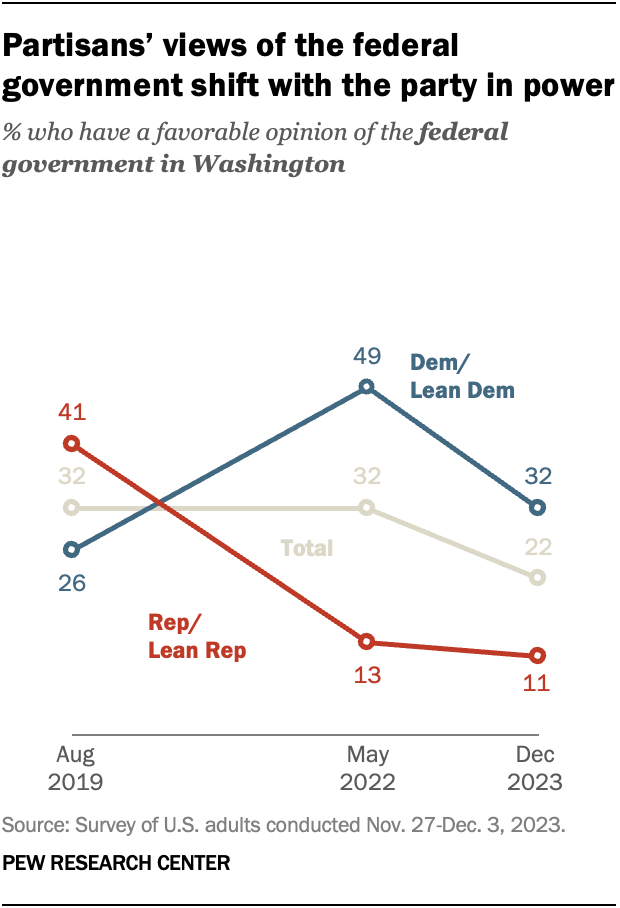
About a third of Democrats and Democratic-leaning independents (32%) have a favorable view of the federal government. This is down 17 points from May 2022, but is still higher than the 26% who expressed a positive view in August 2019, during the Trump administration.
Democrats are about three times as likely as Republicans to offer a positive assessment of the federal government. About one-in-ten Republicans and GOP leaners (11%) see the federal government favorably. This is essentially unchanged since 2022 but substantially lower than in 2019, when 41% had a favorable view.
Opinions of state governments
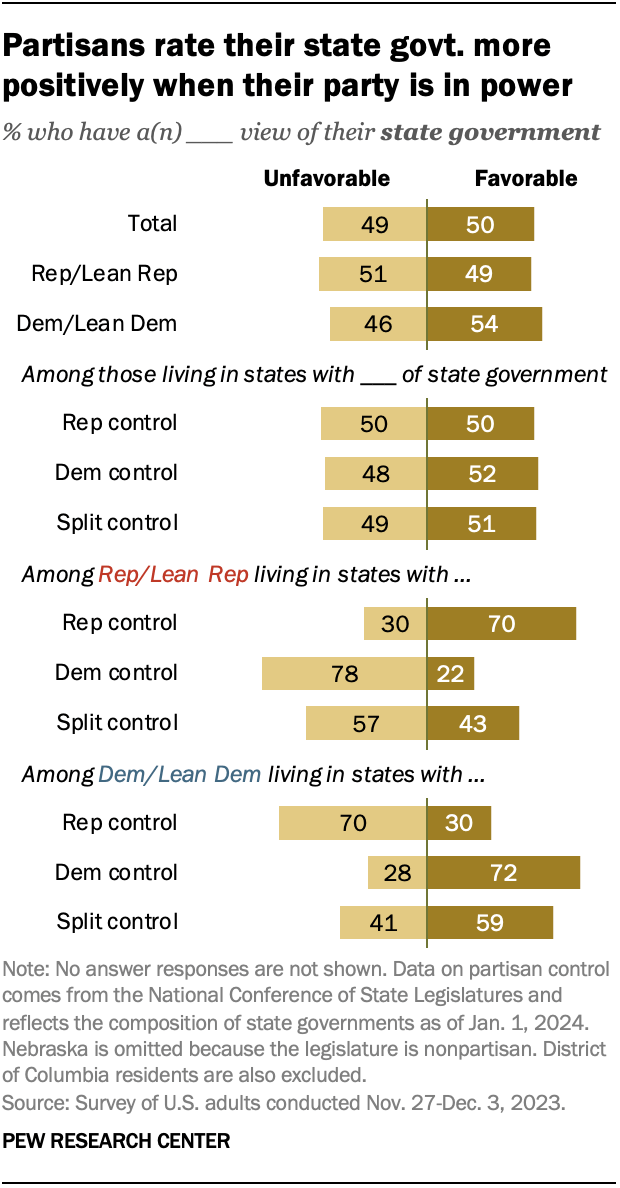
Americans’ views of their state government vary substantially depending on whether their own party is in power or not.
Democrats and Republicans alike have far more favorable views of their state government when the party they support has control of both the legislature and the governorship.
For example, 70% of Republicans living in states with Republican leadership have a positive view of their state government. By comparison, just 43% of Republicans living in states with split control – and only 22% of Republicans living in states with Democratic leadership – have a positive view.
The pattern among Democrats is similar.
Opinions of local governments
Americans differ little by party in opinion of their local government, with similar shares of Republicans (63%) and Democrats (64%) holding favorable views.
Note: Here are the questions used for the report and its methodology.