The Pew Research Center recently released a library user quiz (“What kind of library user are you?”) based on the nationally representative telephone survey findings in our report, “From Distant Admirers to Library Lovers–and beyond: A typology of public library engagement in America.”

Much like our political typology, the library engagement typology sorts Americans ages 16 and older into different groups based on their habits and attitudes—in this case, based on how they use public libraries and perceive libraries’ importance in their communities. The quiz, which has been taken over 15,000 times, is a fun (and non-scientific) way for our website visitors and various community groups to compare their library habits to those of the general population.
So how did the online quiz-takers compare with the results of our nationally representative telephone survey?
One unsurprising finding: If you take a quiz called “What kind of library user are you?”, you probably know the answer.
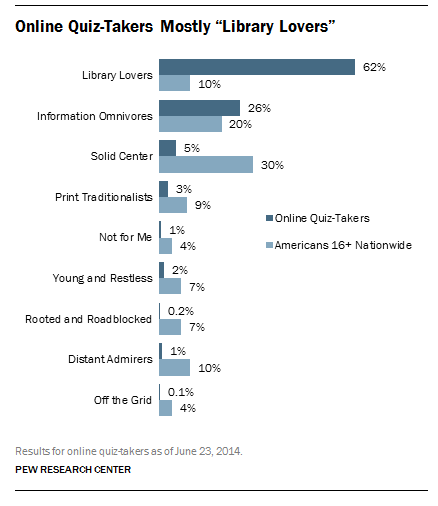
A majority of the online quiz-takers fell into the category of “Library Lovers,” a group that only makes up 10% of the general population. The next largest group among quiz-takers was Information Omnivores, at 26%. (Learn more about the different groups here.) Library Lovers and Information Omnivores are both “high-engagement” groups, characterized by their frequent library use and the high personal value they place on libraries.

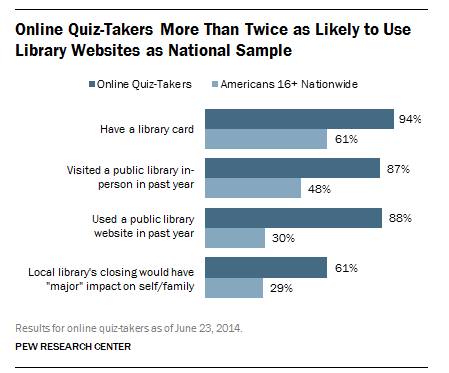
You can also see these higher levels of engagement in the answers to individual questions, as those who have taken our online quiz are much more likely to be active library users than the general population.
Almost all of the quiz-takers (94%) say they have a library card, compared with 61% of the general population, and 87% have visited a library in the past year. Even more notably, 88% have used a public library website in the past year—almost three times the rate of the Americans population overall (30%). This is probably due to a basic self-selection bias: In general, people who are highly engaged with libraries are more likely to take a “library user type” quiz in the first place.

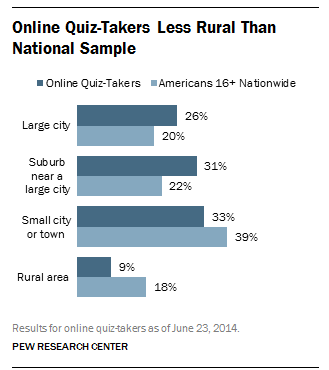
While we don’t have much demographic information about the quiz-takers, we do know that they were much more likely than the general population to live in large cities or nearby suburbs, and less likely to live in a small city or town—and were half as likely as the national population to live in a rural area. This lines up with our previous research, which found that people who live in rural areas are more likely to be older and living in lower-income households, and likewise less likely to use libraries.
