
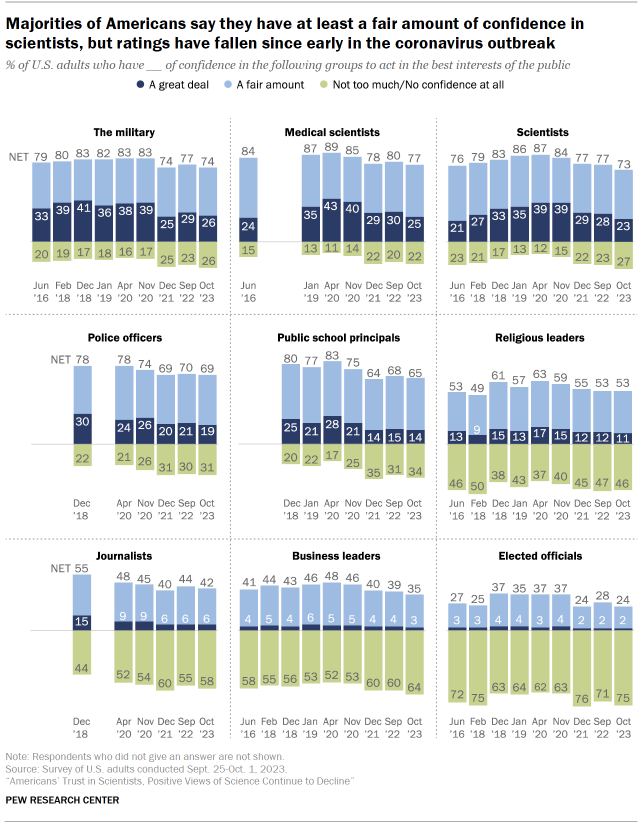
Public confidence in scientists and medical scientists remains higher than most other groups and institutions asked about in the survey.
Roughly three-quarters of Americans say they have a great deal or a fair amount of confidence in medical scientists (77%), the military (74%) and scientists (73%) to act in the public’s best interests. These three groups receive the highest ratings of the nine included in the survey. About a quarter say they have a great deal of confidence in each to act in the public’s best interests.
Somewhat smaller majorities of Americans say they have a great deal or a fair amount of confidence in police officers (69%) and public school principals (65%) to act in the public’s best interests. Slightly more than half (53%) express this level of confidence in religious leaders.
Americans continue to express lower levels of trust in journalists, business leaders and elected officials. Majorities say they have not too much or no confidence at all in these three groups to act in the public’s best interests.
All nine groups in the survey have seen their ratings decline at least a little since early 2020.
Education and trust in scientists
Americans with higher levels of education express greater levels of trust in scientists than those with less formal education.
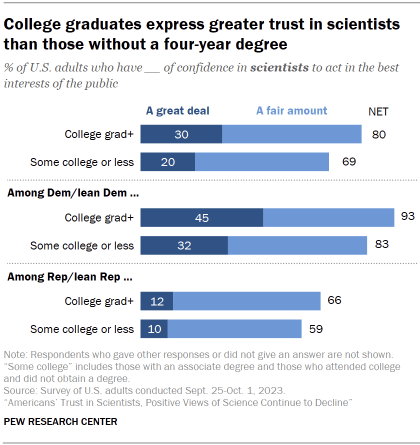
Among those with a bachelor’s degree or more education, 80% have at least a fair amount of confidence in scientists, including 30% who have a great deal of confidence. Among adults with some college or less education, 69% have a least a fair amount of confidence, including 20% who say they have a great deal.
Differences by education are more pronounced within the Democratic Party than the Republican Party. Among Democrats, 45% of those with a bachelor’s degree or more education say they have a great deal of confidence in scientists, compared with 32% of those with some college experience or less education.
Still, strong trust in scientists has continued to decline in the last year among Democrats with at least a bachelor’s degree (down 8 percentage points since September 2022 and down 21 points since November 2020). By comparison, most of the declines in trust among Democrats with some college experience or less education occur between November 2020 and December 2021 (down 13 points). Refer to the Appendix for more details.
Among Republicans, small shares of both those with a bachelor’s degree or more education (12%) and those with some college experience or less education (10%) have a great deal of confidence in scientists. Strong trust among both groups fell sharply in the early months of the coronavirus outbreak, while changes have been more modest in the last two years.
Race and ethnicity and trust in scientists
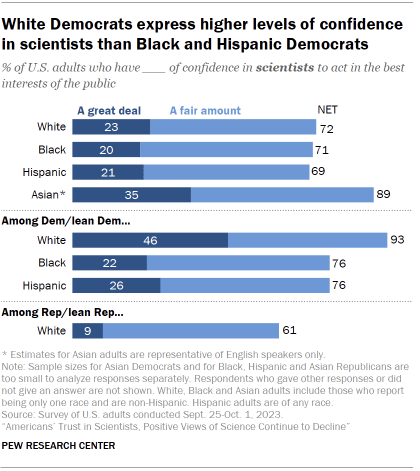
White, Black and Hispanic adults have similar levels of confidence in scientists and medical scientists overall. Asian adults express the highest confidence in scientists and medical scientists across racial and ethnic groups.
Among Democrats, however, larger shares of White Democrats (46%) than Hispanic (26%) and Black Democrats (22%) say they have a great deal of confidence in scientists. (Sample size for Asian Democrats is too small to analyze responses separately.)
There are similar patterns in views of medical scientists. Refer to the Appendix for more details.
This survey includes a total sample size of 653 Asian adults. The sample primarily includes English-speaking Asian adults and, therefore, may not be representative of the overall Asian adult population. Despite this limitation, it is important to report the views of Asian adults on the topics in this study. As always, Asian adults’ responses are incorporated into the general population figures throughout this report.


