
For Latino registered voters, the economy is the top issue affecting their vote ahead of this fall’s midterm election, followed by health care, education, violent crime and gun policy. About half of Latino voters say they plan to vote for the Democratic candidate in their district’s election for the U.S. House of Representatives; 28% say they plan to vote for the Republican candidate, and 18% are either not sure who they will vote for or plan to support another candidate. While Latinos voted at lower rates than other groups in 2018, about two-thirds of Latino voters (67%) say they have given at least some thought to the upcoming midterm elections. When it comes to the president’s job approval rating, Latino voters have mixed views of Joe Biden, with 45% approving of his job performance and 54% disapproving. Meanwhile, a clear majority of Latinos (73%) say they do not want former President Donald Trump to remain a national political figure.
Economy is top voting issue for Latino registered voters in 2022
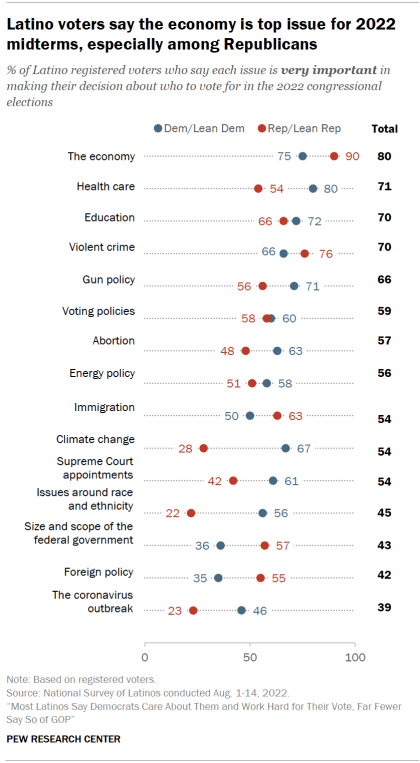
Eight-in-ten Hispanic registered voters (80%) say the economy is very important in making their decision about who to vote for in the 2022 congressional elections. Health care (71%), education (70%), violent crime (70%) and gun policy (66%) are the next most cited issues. Meanwhile, half or more of Hispanic voters say abortion (57%) and immigration (54%) are very important to their vote in the midterm elections this year.
Abortion has risen in importance as a voting issue for Hispanics who are registered to vote since the spring: It rose from 42% in March to 57% in August. The increase is driven primarily by Hispanic Democrats and Democratic leaners registered to vote (42% in March and 63% in August). By comparison, the share of Hispanic Republicans and Republican leaners registered to vote who say abortion is a very important voting issue has remained relatively flat (43% in March vs. 48% in August).
Latino Democrats and Democratic-leaning registered voters are far more likely than Latino Republicans and Republican-leaning voters to say health care is very important to their vote (80% vs. 54%). Health care is a top issue for Democrats, along with the economy (75%). Latino Democrats also prioritize climate change more than Latino Republicans (67% vs. 28%).
Hispanic Republican and Republican-leaning registered voters are more likely than Hispanic Democratic and Democratic-leaning voters to say the economy is very important to their vote (90% vs. 75%). Violent crime (76%) is another top issue among Hispanic Republicans. Republicans are also more likely than Democrats to cite foreign policy (55% vs. 35%) and the size and scope of the federal government (57% vs. 36%) as top issues.
Partisans also differ in their views on issues that the U.S. Supreme Court has weighed in on this year. Hispanic Democratic and Democratic-leaning voters are more likely than Hispanic Republican and Republican-leaning voters to say gun policy (71% vs. 56%) and abortion (63% vs. 48%) are very important issues for their vote in the 2022 midterm elections.
Hispanic Democratic voters and Hispanic Republican voters have similar views on the importance of voting policies, with about six-in-ten in each group saying it is very important to their vote.
2022 midterm election preferences of Latinos
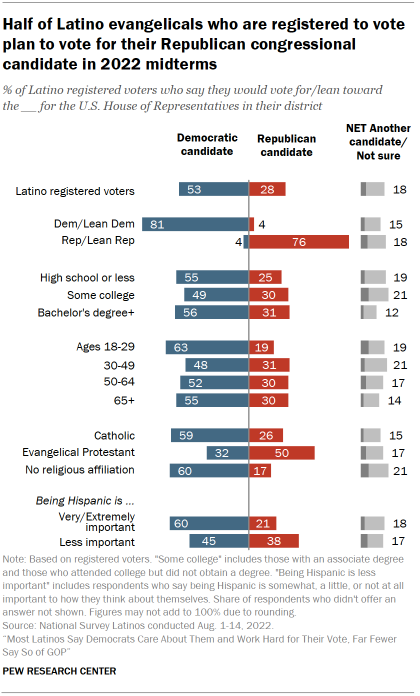
About half of Latino registered voters (53%) say they would vote for or lean toward the Democratic candidate in their district’s U.S. House race and 28% would vote Republican, with Latino partisans strongly preferring their own party’s candidate. Nearly one-in-five Latino voters (18%) say they are not sure who they would vote for or would back another candidate.
Some of the sharpest differences in candidate preference are by religion. Half of Latino evangelical Protestants say they would vote for the Republican candidate for U.S. House, while a majority of Latino Catholics (59%) and the religiously unaffiliated (60%) say they would vote for the Democratic candidate.
Young Latino registered voters are more likely than older Latino registered voters to say they would vote for the Democratic candidate in their House district. Among Latino voters, 63% of those ages 18 to 29 say they would vote Democratic, a greater share than among those ages 30 to 49 (48%) and ages 50 to 64 (52%). Meanwhile, 55% of Latino voters ages 65 or older say they would vote for the Democratic candidate.
Six-in-ten Hispanics who say being Hispanic is very or extremely important to how they think of themselves say they would vote for the Democratic candidate in their House district. Meanwhile, those who say being Hispanic is less important to how they see themselves are more evenly split between voting for the Democratic and Republican candidates (45% vs. 38%).
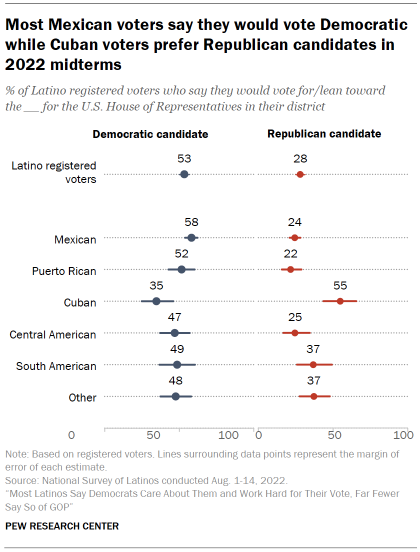
Mexican registered voters are about twice as likely to say they would vote for the Democratic than the Republican congressional candidate in their House district in the upcoming midterm elections (58% vs. 24%). Puerto Rican voters have similar preferences, with 52% saying they’d vote Democratic versus 22% saying they would vote Republican.
Latino voter engagement for 2022 midterms
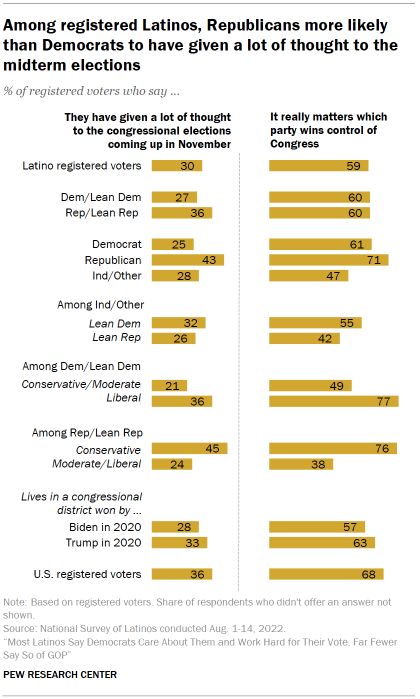
As the midterm elections near, Latino Republican registered voters are more likely than other Latino registered voters to say they are thinking about the elections. Some 43% of Latino Republican registered voters say they have given a lot of thought to the upcoming congressional elections; only about a quarter of Latino Democratic (25%) and Latino independent (28%) registered voters say they have done the same.
Meanwhile, among Latino voters who are independent or don’t identify as partisan, 32% who lean Democratic and 26% who lean Republican have given a lot of thought to the midterms.
Among Latino registered voter Democrats and Latino independents who lean Democratic, more liberals (36%) than conservatives and moderates (21%) say they have given a lot of thought to the elections. Among Latino voters who identify with or lean toward the Republican Party, more conservatives (45%) than moderates and liberals (24%) say they have thought a lot about the midterms.
Compared with how many have given thought to the midterms, greater shares of Latino registered voters (59%) say it really matters who wins control of congress. Among Latino voters, similar shares of Republicans (71%) and Democrats (61%) say it really matters who wins. Yet, among Latino independents and nonpartisans, a greater share of Democratic leaners than Republican leaners say it really matters who wins (55% vs. 42%).
Large shares of partisans at both ends of the ideological spectrum say it really matters who wins control of Congress. Among Latino Democrats and Democratic leaning voters, far more liberals (77%) than conservatives and moderates (49%) say it really matters who wins. Among Latino Republican and Republican-leaning voters, greater shares of conservatives (76%) than moderates and liberals (38%) say it really matters who wins.
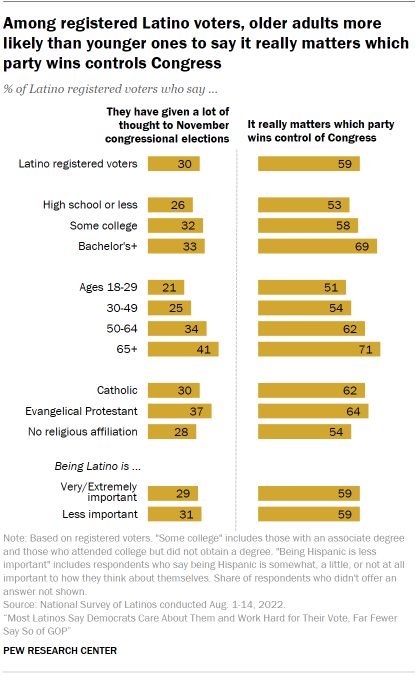
Older Latino voters are more likely than younger Latino voters to say they have given a lot of thought to the upcoming midterm elections, and to say it really matters which party wins control of Congress.
A greater share of Latino voters ages 50 to 64 (34%) and ages 65 or older (41%) say they have given a lot of thought to the midterms than have Latino voters ages 30 to 49 (25%) and 18 to 29 (21%).
Meanwhile, clear majorities of Latino voters ages 65 or older (71%) and ages 50 to 64 (62%) say it really matters which party wins control of Congress, while smaller shares of Latino voters ages 30 to 49 (54%) and 18 to 29 (51%) say the same.
Latinos’ views of Biden
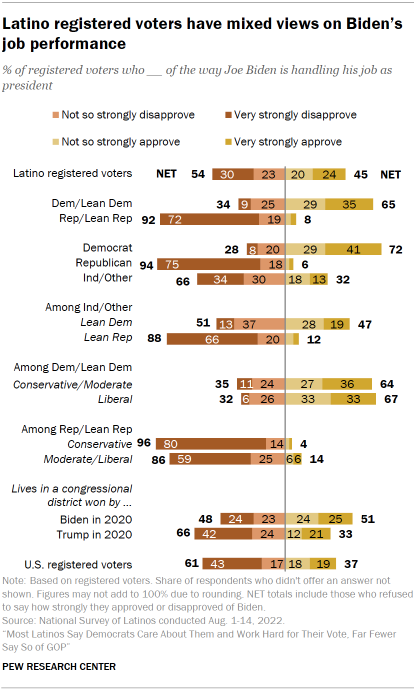
Most Latino registered voters (54%) say they disapprove of the job Joe Biden is doing as president while slightly less than half (45%) approve. By comparison, a slightly greater share (61%) of U.S. voters overall disapprove of Biden.
Views of Biden’s job performance break along party lines among Latino registered voters, just as with all U.S. voters. About three-quarters of Latino Democratic voters (72%) say they approve of Biden’s job performance. By contrast, nearly all Latino Republican voters (94%) disapprove of Biden.
Yet, among Latino voters who are independent or are not partisan, Democratic leaners have mixed views of Biden’s job performance (47% approve), while the views of Republican leaners are more aligned with Republican partisans (88% disapprove).
Opinions among Latino Democrats and Democratic-leaning voters do not vary much by their ideological views: About two-thirds of liberals (67%) and conservatives and moderates (64%) approve of Biden’s job performance. Among Latino Republicans and Republican-leaning voters, large shares of conservatives (96%) and moderates and liberals (87%) disapprove of Biden.
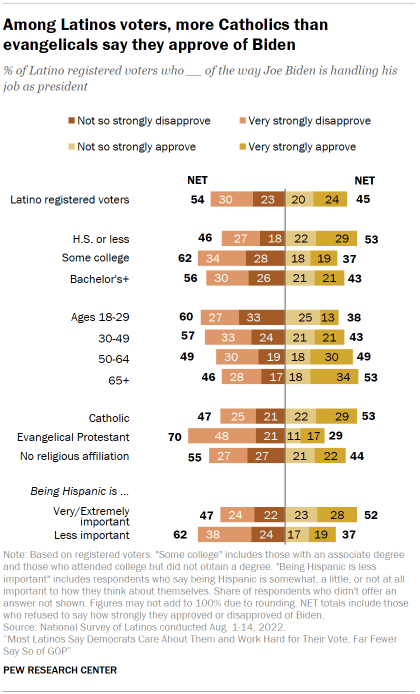
Among Latino registered voters, about half of Catholics (53%) say they approve of Biden’s job performance, while 70% of evangelicals say they disapprove of Biden.
About half of Latino registered voters with a high school education or less (53%) approve of Biden, a greater share than among Latino voters with some college education or more. Similar shares of Latino voters born in the U.S. (45%) and Latino immigrant voters (47%) say they approve of Biden.
Meanwhile, about half of Hispanics who say being Hispanic is important to how they think of themselves (52%) say they approve of Biden, compared with 37% of those who say being Hispanic is less important.
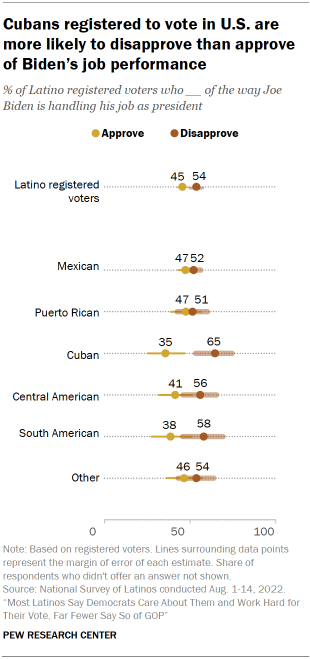
A majority of Cuban registered voters say they disapprove of the way Biden is handling his job as president. By comparison, Mexican voters (52%) and Puerto Rican voters (51%) are split on their disapproval.
Latinos’ views of Trump
About three-quarters of Latino registered voters (73%) say Donald Trump should not remain a national political figure, a slightly greater share than among U.S. adults overall (66%). This share rises to 94% among Latino Democratic voters.
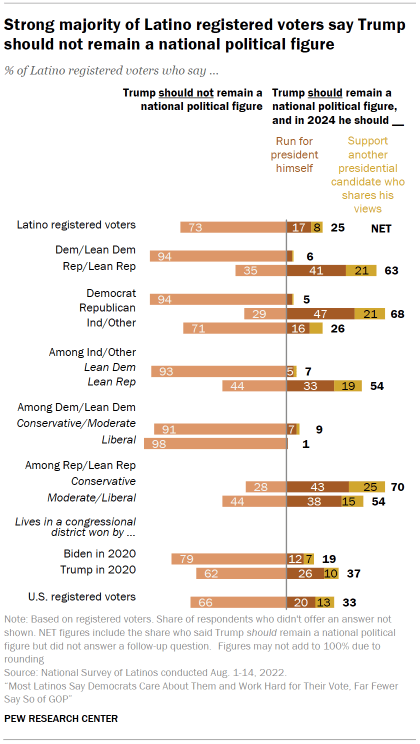
Only a quarter of Latino registered voters (25%) want Trump to remain a national political figure, including 17% who want Trump to run for president in 2024. However, about two-thirds of Latino Republican registered voters (68%) want Trump to remain a national figure, including nearly half (47%) who say he should run for president in 2024.
Among Latino independent or politically unaffiliated voters who lean Democratic, 93% say Trump should not remain a national political figure, a similar share to overall Latino Democratic voters who say this. About half of Latino independent or politically unaffiliated voters who lean Republican (54%) want Trump to remain a national figure, including 33% who want him to run for president in 2024.
Views of Trump do not vary among Latino registered voters by education, nativity, age or gender, though a slightly greater share of Hispanic men than Hispanic women (20% vs. 14%) say they would like to see Trump run for president in 2024.
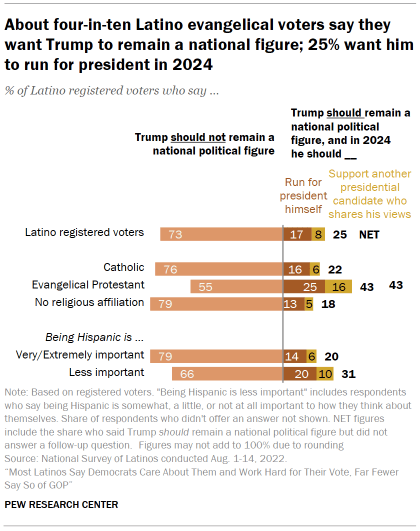
Evangelicals are among the Latinos most likely to say they want Trump to run for president again. About four-in-ten Latino evangelical registered voters (43%) say they want Trump to remain a national figure, including 25% who want him to run for president in 2024. Still, about half of Latino evangelical voters (55%) do not want Trump to remain a national political figure. By contrast, greater shares of Latino Catholic voters (76%) and Latino voters with no religious affiliation (79%) do not want Trump to remain a national political figure.
The vast majority of Hispanic voters who say being Hispanic is very or extremely important to how they think of themselves (79%) say they do not want Trump to remain a national figure. This share falls to 66% among Hispanic voters who say being Hispanic is less important to how they think of themselves.
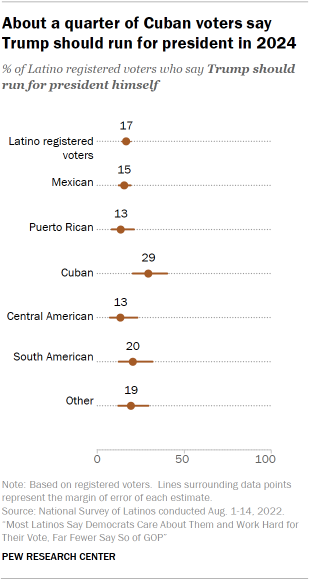
Cuban registered voters are more likely than Latino registered voters overall (25%) to say Trump should remain a major national political figure. Relatively few Latino voters who are Mexican (23%) or Puerto Rican (21%) say they want Trump to remain a major national figure, with only 15% of Mexicans and 13% of Puerto Ricans saying they want Trump to run for president again.
Most Latinos say their vote can matter
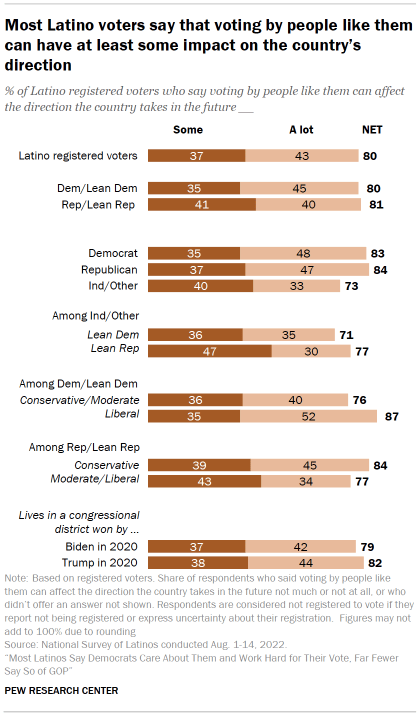
Eight-in-ten Latino registered voters (80%) say voting by people like them can affect the country’s direction some (37%) or a lot (43%). Latino independents and those who do not identify with a party are less likely to say so (73%) than Democrats or Republicans, though most still feel their vote can make a difference.
Among Democrats and Democratic-leaning Latino voters, more liberals (87%) than conservatives and moderates (76%) say voting by people like them can make a difference, with about three-quarters or more of each saying so. Among Republicans and Republican-leaning Latino voters, similarly large shares of conservatives (84%) and liberals and moderates (77%) say their vote can make a difference.
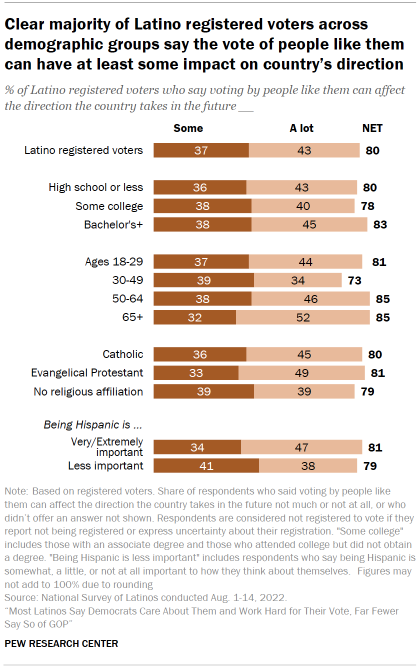
The share of Latino registered voters who say voting can make a difference is relatively large across education and religious groups, though some differences by age exist. The vast majority of Latino voters ages 50 to 64 (85%) and 65 or older (85%) say voting by people like them can affect the nation’s direction, a greater share than among Latino voters ages 30 to 49 (73%). Meanwhile, 81% of younger Latino voters ages 18 to 29 say their votes can make a difference.
Most Hispanic voters say there is a candidate who shares their views
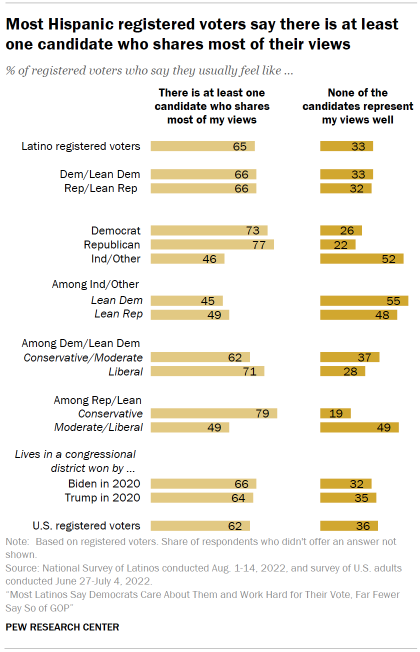
According to the new survey, a majority of Hispanic registered voters (65%) say they usually feel like there is at least one political candidate who shares most of their views. Even so, this view is not universal, as partisans are more likely to say this than are independents. While about seven-in-ten Democrats (73%) and nearly eight-in-ten Republicans (77%) say there is at least one candidate who shares most of their views, only 46% of independent and nonpartisan Hispanic voters say the same.
Among Hispanic Republicans and Republican-leaning voters, 79% of conservatives say there is at least one candidate who shares most of their views. But Hispanic Republicans and Republican-leaning voters with moderate or liberal political views are as likely to say there is a candidate that shares their views (49%) as they are to say none of the candidates represent their views (49%).
How issues influence candidate choice among Latino voters
Most Latino registered voters say they would probably or definitely not vote for a candidate who disagrees with them on the economy, immigration, gun policy or abortion, even if the candidate agrees with them on most other issues. About six-in-ten or more Latino voters say they hold this view about abortion (68%), gun policy (66%), immigration (61%) and the economy (61%).
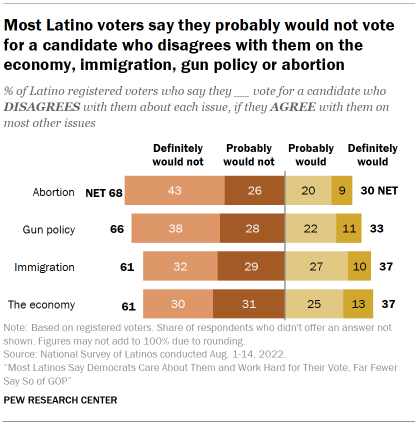
Most Hispanic Republicans and Republican-leaning voters say they would probably not vote for a candidate who disagrees with them on the economy, gun policy, immigration or abortion – about 60% or more say so for each. Meanwhile, a clear majority of Hispanic Democrats and Democratic-leaning voters say they probably would not vote for a candidate who disagrees with them on abortion (72%) and gun policy (67%). Similar shares say the same of immigration (60%) and the economy (58%).
