Understandably, most of the attention in this fall’s elections has been on likely voters, not on those unlikely to cast a ballot.
Almost certainly, however, there will be far more nonvoters1 than voters this year.
Turnout in midterm elections typically is less than 40% of the voting age population (in 2006 it was 37%), and there is no reason to expect that it will be dramatically higher in 2010.
Who are these likely nonvoters who constitute a majority of the American public this year?
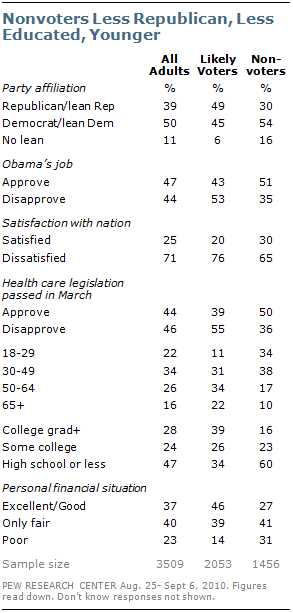
Based on an analysis of a September national survey by the Pew Research Center for the People & the Press, nonvoters are younger, less educated and more financially stressed than likely voters.2
Nonvoters are significantly less Republican in their party affiliation than are likely voters, and more supportive of an activist federal government.3
Despite their more difficult economic circumstances, nonvoters express greater satisfaction with national conditions than do likely voters, and are more likely to approve of Barack Obama’s job performance.
The Demographics of Nonvoters
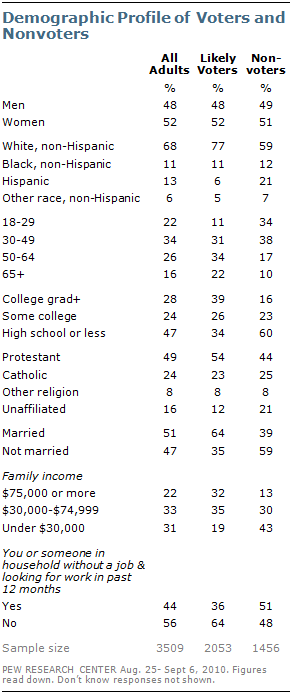
As is typical in U.S. elections, nonvoters are significantly younger, less educated and less affluent than are likely voters.
Nearly three-quarters of nonvoters (72%) are younger than age 50, compared with only 42% of likely voters.
Similarly, a majority of nonvoters (60%) have not gone beyond high school, compared with just 34% among those likely to vote.
This education gap is somewhat larger among young people: 55% of nonvoters younger than age 40 have only a high school education, while the figure among young likely voters is just 20%.
Low education levels and low incomes go hand-in-hand: 43% of nonvoters have family incomes under $30,000, compared with just 19% among likely voters.
Reflecting their low incomes, many more nonvoters (31%) than likely voters (14%) describe their personal financial situation as poor, and fully 51% of nonvoters say that they or someone in their household was out of work and looking for a job at some point in the past 12 months. Among voters, 36% had this personal experience with unemployment.
A much higher proportion of nonvoters than voters identify as Hispanic or Latino: 21% of nonvoters vs. 6% of voters.
Part of this difference, of course, reflects the fact that nearly four-in-ten (37%) Latinos in the U.S. are not citizens and thus not eligible to vote.
Nonvoters More Liberal on Many Issues
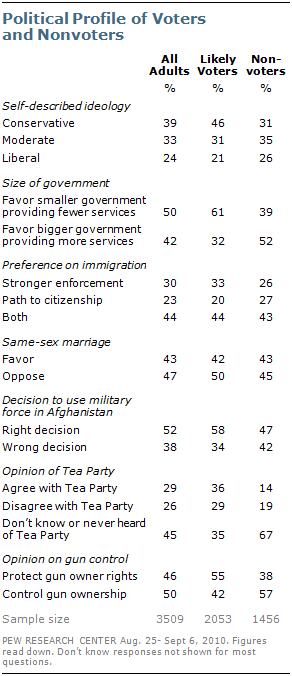
Across a range of topics, nonvoters generally express more liberal views than do likely voters, though there are some exceptions.
Fewer nonvoters than voters describe their own political philosophy as conservative (31% for nonvoters, 46% for voters).
And while 52% of nonvoters express a preference for a bigger government providing more services, most likely voters (61%) prefer a smaller government providing fewer services.
Nonvoters are slightly less supportive of the decision to go to war in Afghanistan, with 47% calling it the right decision compared with 58% among likely voters.
A somewhat larger difference exists on gun control: most nonvoters (57%) say it is more important to control gun ownership; by contrast, most voters (55%) say it is more important to protect the rights of gun owners.
Differences between voters and nonvoters are more muted on some other questions, however.
Comparable percentages of both groups favor immigration reforms that both strengthen enforcement and provide illegal immigrants with a way to become citizens if they meet certain conditions.
And nearly equal percentages say they favor allowing gays and lesbians to marry legally.
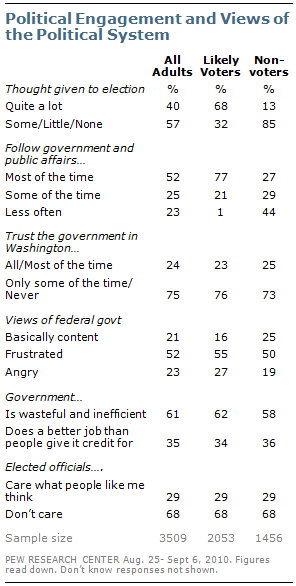
Not surprisingly, nonvoters are largely disengaged from national politics. They are far less likely to express interest in the election or in politics and government more generally.
Just 13% say they have given a lot of thought to the election; among likely voters, 68% have done so.
Just 27% say they follow what is going on in government and public affairs most of the time; 77% of voters say they do this.
Nonvoting does not appear to be a byproduct of contentment with the political system.
Somewhat more nonvoters than voters say they are basically content with the federal government (25% among nonvoters, 16% among likely voters), but this is a decidedly minority view.
Fully half of nonvoters are frustrated with government and 19% say they are angry.
Similarly, most nonvoters (73%) say they can trust the government in Washington to do what’s right only some of the time, or never. This is about the same level of distrust expressed by voters (76%).
1. Non-voters are designated as any respondent who does not meet the criteria for “likely voters” as used in Pew Research Center polls. Likelihood of voting is determined as a function of several variables including self-reported frequency of past voting, likelihood of voting in the coming election, whether voted in previous presidential election, amount of thought given to the election and attention to election news and politics in general. See “Understanding Likely Voters.” 2. For details about the survey, including full wording for all questions see: “Independents Oppose Party in Power … Again,” Sept. 23, 2010. 3. In Pew Research surveys, many nonvoters are typically not asked how they would vote in elections.


