Updated February 25, 2016
A version of this paper was published in the Statistical Journal of the IAOS.
By Katie Simmons, Andrew Mercer, Steve Schwarzer and Courtney Kennedy
Concern about data falsification is as old as the profession of public opinion polling. However, the extent of data falsification is difficult to quantify and not well documented. As a result, the impact of falsification on statistical estimates is essentially unknown. Nonetheless, there is an established approach to address the problem of data falsification which includes prevention, for example by training interviewers and providing close supervision, and detection, such as through careful evaluation of patterns in the technical data, also referred to as paradata, and the substantive data.
In a recent paper, Kuriakose and Robbins (2015) propose a new approach to detecting falsification. The measure is an extension of the traditional method of looking for duplicates within datasets. What is new about their approach is the assertion that the presence of respondents that match another respondent on more than 85% of questions, what we refer to as a high match, indicates likely falsification. They apply this threshold to a range of publicly available international survey datasets and conclude that one-in-five international survey datasets likely contain falsified data.
The claim that there is widespread falsification in international surveys is clearly concerning. However, an extensive investigation conducted by Pew Research Center and summarized in this report finds the claim is not well supported. The results demonstrate that natural, benign survey features can explain high match rates. Specifically, the threshold that Kuriakose and Robbins propose is extremely sensitive to the number of questions, number of response options, number of respondents, and homogeneity within the population. Because of this sensitivity to multiple parameters, under real-world conditions it is possible for respondents to match on any percentage of questions even when the survey data is valid and uncorrupted. In other words, our analysis indicates the proposed threshold is prone to generating false positives – suggesting falsification when, in fact, there is none. Perhaps the most compelling evidence that casts doubt on the claim of widespread falsification is in the way the approach implicates some high-quality U.S. surveys. The threshold generates false positives in data with no suspected falsification but that has similar characteristics to the international surveys called into question.
This paper proceeds as follows. First, we briefly review the problem of data falsification in surveys and how it is typically addressed. Second, we summarize Kuriakose and Robbins’ argument for their proposed threshold for identifying falsified data and discuss our concerns about their evidence. Third, we outline the research steps we followed to evaluate the proposed threshold and then review in detail the results of our analysis. Finally, we conclude with a discussion of the findings and other ways the field is working to improve quality control methods.
I. Data Falsification in Surveys
All survey data, independent of the mode of data collection, are susceptible to survey error. Groves et al. (2009) outline the various sources of error that can affect surveys under the total survey error framework. One especially concerning source of error is data falsification.
[the agents]
In an early study on data falsification, Crespi (1945) argued that the departure from interview protocols is less a problem of morality, and more a problem of morale (p. 431). Crespi, who mainly focused on interviewers, outlined the various factors that might discourage interviewers from faithfully performing their duties, including questionnaire characteristics (long, complex or sensitive questionnaires), administrative aspects (inadequate remuneration or insufficient training of interviewers), and external factors (bad weather, unsafe neighborhoods or difficult-to-reach areas).
The extent of the problem of data falsification is not clearly established, although we know the problem exists (Singer, 2008; Loosveldt, 2008). Studies have mainly focused on interviewer-based modes, especially face-to-face surveys. Research shows that inexperienced interviewers are more likely to falsify data, and to do so on a broader scale than more-experienced interviewers (Schreiner et al., 1988; Hood & Bushery, 1997). Nonetheless, only a few studies report estimates of the magnitude of falsification. These studies evaluated large-scale, cross-sectional surveys and suggest the proportion of falsified interviews rarely exceeds 5% (Schreiner et al., 1988; Schraepler & Wagner, 2005; Li et al., 2009).
The impact of the presence of falsified data on survey results is unclear. The evidence provided in the literature does not definitively conclude whether falsified data alters marginal distributions or the results of multivariate statistical techniques (e.g. Reuband, 1990; Schnell, 1991; Diekmann, 2002; Schraepler & Wagner, 2005). All of this research, however, is based on surveys that included only small proportions of falsified data.
Regardless of the extent of data falsification, the public opinion field is highly concerned with addressing the problem. The standard approach is twofold: prevention and detection (AAPOR, 2003; Lyberg & Biemer, 2008; Lyberg & Stukel, 2010). Prevention includes developing a relationship with vendors, carefully training interviewers on the goals, protocols and design of a particular survey, as well as the general principles and practices of interviewing, remunerating interviewers appropriately, limiting the number of interviews any given interviewer is responsible for, supervising a subset of the interviews for each interviewer, and, finally, re-contacting or re-interviewing, typically referred to as backchecking, a subset of the interviews of each interviewer to verify they were completed and conducted as documented. But prevention can be costly. And even though it can be highly effective, it is not a guarantee of perfectly valid data (Koch, 1995; Hood & Bushery, 1997).
Detection methods serve two purposes. First, they help in evaluating the performance of the costly prevention methods. Second, they can be used to identify falsified interviews that slipped past preventive measures (Bredl et al., 2012; Diakité, 2013; Menold & Kemper, 2013; Winker et al., 2013). Detection methods entail evaluation of key indicators, including paradata (interview length, timestamps, geocoding, timing of interviews), interviewer-related data (experience, daily workload, success rates), and interview-related data (characteristics of respondents, interview recordings, backchecking results), as well as analysis of the structure of responses (Benford’s law, refusals, extreme values, coherence of responses, consistency in time series, duplicates).
But detection methods merely flag data that is possibly suspicious. Identification of falsified data is not the result of a single measure, but an assessment of the different aspects within the study-specific environment in which interviewers conduct their work. Judge and Schechter (2009) conclude from their analysis of survey data that multiple factors might contribute to suspicious-looking patterns in data and that detection methods should not be used “in isolation when judging the quality of a dataset” (p. 24). All concerns require intensive follow-up with vendors to determine the underlying explanation of the patterns.
Kuriakose and Robbins propose a new detection method, suggesting a hard threshold for the number of high matches in a dataset to flag falsified data. The next section outlines their argument.
II.a Kuriakose and Robbins’ Procedure and Threshold
In their paper, Kuriakose and Robbins are concerned with a specific type of possible falsification whereby interviewers, supervisors or even the head office of a survey firm duplicate the responses of valid interviews to reach the required sample size. To avoid detection, the falsifier(s) would modify the responses to a few questions for each respondent so that the respondents are not exact duplicates of one another.
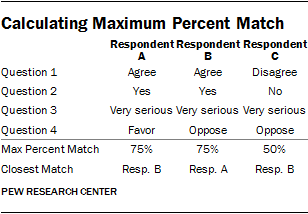
With this model of falsification in mind, the authors develop a tool for the statistical program Stata that identifies the maximum percentage of questions on which each respondent matches any other respondent in the dataset. If respondent A matches respondent B on 75% of questions and matches respondent C on 25% of questions, the maximum percent match statistic for respondent A is 75%. The table illustrates this example.
Kuriakose and Robbins argue that two respondents that match on a high percentage of questions should be a rare occurrence in valid data. They make their case for this conclusion based on a review of public opinion literature, simulations with synthetic data and analysis of U.S. data from the widely respected and trusted American National Election Studies (ANES) and General Social Survey (GSS).
The authors cite Converse (1964) and Zaller (1992), two scholars who helped establish the conventional wisdom that individuals’ political beliefs are only weakly held and rarely structured coherently along ideological lines. Because of this, respondents tend to be inconsistent in their responses to survey questions about similar topics, not only over time but even within the same survey. Kuriakose and Robbins extend this logic to argue that two respondents who share the same attitudes are highly unlikely to give consistently similar responses to survey questions.
To further develop this theoretical expectation, Kuriakose and Robbins conducted a Monte Carlo simulation with synthetic data. Simulations with synthetic data can be useful for understanding complex statistical processes that are difficult to observe in real-world data. A potential drawback of using synthetic data, however, is that the predictions generated may have little bearing on reality if the researcher’s assumptions do not reasonably represent the structure of real-world data.
For their first simulation, Kuriakose and Robbins randomly generated 100,000 synthetic datasets, each containing 1,000 respondents and 100 independent variables. The variables were randomly assigned a value of either 1 or 0 for each respondent. The probability of any value falling on 1 or 0 is not specified in the paper, though it appears that for all of the simulated variables either outcome is equally likely, meaning that each variable has a mean value of 0.5. The authors then calculated the maximum percent match statistic for each respondent. In this simulation, they find that this statistic has a mean of 66% and never exceeds 85% over all 100,000 simulations.
As Kuriakose and Robbins discuss, their first simulation assumed the variables in the dataset were independent of one another, which is a very different situation from actual survey data. To address this limitation, they repeated this simulation using a randomly generated correlation matrix to test the situation where the variables are not independent and find that the maximum percent match statistic again never exceeds 85%, although the mean value is higher than when the variables are independent. Kuriakose and Robbins suggest that compared with a true survey, their simulations are a conservative test of the maximum percent match in a dataset because most surveys use questions consisting of many more than two values. That is, they expect that, on average, the simulation should have higher maximum percent matches than occur in practice with nonfalsified data.
To validate the results of their simulation, Kuriakose and Robbins calculate the maximum percent match statistic on datasets from two studies conducted in the United States – all available waves from the American National Election Studies (ANES, 1948 to 2012) and the General Social Survey (GSS, 1972 to 2014) that included at least 100 questions. Across all of these datasets, the authors found 35 respondents that matched another respondent on more than 85% of the questions, which accounted for less than 0.05% of all respondents.
Kuriakose and Robbins take these findings to be a confirmation of their simulated results, and conclude that a reasonable threshold to identify likely falsification is the percentage of respondents that match another respondent on more than 85% of all substantive variables. The authors argue that the presence of more than 5% of respondents in a dataset that are considered high matches according to the 85% threshold indicates likely data falsification.
II.b Concerns about Kuriakose and Robbins’ Approach
Given the challenges all researchers face in collecting high quality survey data domestically and internationally, Kuriakose and Robbins’ effort to develop a new diagnostic tool is part of an important line of research. However, the logic behind the authors’ approach has two major flaws. The first is that the mathematical assumptions underpinning their argument are inappropriate. The second is that their simulations, which are one of the key foundations for their established threshold, are underspecified and bear little resemblance to real-world survey data.
Kuriakose and Robbins’ initial theoretical expectations about whether two respondents will give identical answers to a subset of questions (85%) are based on the likelihood of two respondents giving identical answers to all questions. The authors note that two respondents with a 95% chance of agreeing on each of 100 questions will match on all 100 questions less than 1% of the time (p. 4). However, what the authors do not address is that the probability of matching on a subset of questions, such as 85%, is exponentially higher than the probability of matching on all questions. For example, in a 100-question survey, there is only one set of questions that allows two respondents to match on all 100 questions. But there are 3.1×10¹⁷ different sets of questions that allow two respondents to match on at least 85 of the questions. This means that two respondents with a 95% chance of agreeing on each of the 100 questions will agree on at least 85 of those questions over 99% of the time.
This points to the larger weakness in the approach taken by Kuriakose and Robbins – namely that the authors do not systematically evaluate the survey characteristics that would cause the probability of high matches to vary, such as the sample size, the number of questions, the number of response options or homogeneity within the population. These parameters have a direct bearing both on the number of possible response combinations as well as the number of respondents that are a potential match.
Kuriakose and Robbins assert that their Monte Carlo simulations provide a conservative estimate of the distribution of the maximum percent match statistic. As we will show, however, they chose very specific conditions for their simulations – 100 questions, 1,000 respondents, 0.5 means for all variables – that led them to find few high matches. In particular, the assumption that all variables have a mean of 0.5 bears little resemblance to reality. In most public opinion surveys, some proportions are closer to either zero or one, reflecting the fact that there are often majority opinions or behaviors on topics studied in surveys. Assuming that the mean of each and every question in a survey is 0.5 underestimates the degree to which there is some natural similarity between respondents.
Given our concern about the authors’ claim of widespread falsification in international surveys but also our doubts about the arguments underlying their proposed threshold, we pursued a multistep research design to fully understand whether the presence of high matches in a survey dataset is a result of fraud or of various survey characteristics.
III. a Evaluating the Threshold
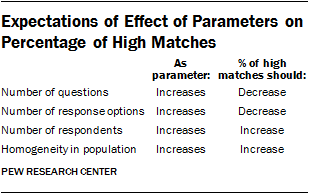
We evaluated the sensitivity of the proposed threshold to additional parameters not tested in the original paper in an attempt to better understand how the statistic would react to variation in real-world survey conditions. The first parameter is the number of questions. With more questions, the probability that two respondents match on a large percentage of those questions should decline. The second is the number of response options in the questions. With more response options, respondents are less likely to give the same answer as someone else. The third is the number of respondents. With more respondents in the dataset, there are more opportunities for respondents to match. The fourth is the homogeneity within the sample. When the content of the survey or the population being surveyed lead to greater homogeneity of opinion, either in the full sample or among certain subgroups, the probability of a match between two respondents should increase. The table summarizes these expectations.
We evaluated the impact of these four parameters on the percentage of high matches in datasets with simulations using synthetic data and actual survey data, as well as with analysis of high-quality U.S. and international surveys. We find that Kuriakose and Robbins’ threshold is extremely sensitive to all four parameters discussed above. Because it is possible to get high maximum percent matches with nonfalsified data under some fairly common conditions, our analysis indicates that it is not appropriate to use a single threshold for the maximum percent match statistic to identify falsification.
Simulations with synthetic data
Simulations are useful because they allow the researcher to conduct analysis in a very controlled environment. We can set the conditions for the parameters we think should matter and evaluate how a statistic changes when we vary just one of those parameters. This type of analysis allows us to develop theoretical expectations about how real-world data should behave. A serious limitation of using synthetic data for this type of analysis, however, is that if the assumptions are significantly different from real-world situations, the theoretical expectations derived from them may not be very useful.
We repeated Kuriakose and Robbins’ simulation which used independent binary variables where the mean of each variable was 0.5. We extended their analysis by varying the number of questions, the number of respondents, and the mean of the variables. For the number of questions, we tested values ranging from 20 to 120 in increments of 20. For the number of respondents, we tested values from 500 to 2,500 in increments of 500. We conducted this set of simulations twice. The first time we set the mean of each variable at 0.5, consistent with Kuriakose and Robbins’ approach. The second time, we set the mean of each variable at random from a uniform distribution between 0 and 1. This second condition more closely resembles the reality of survey data, where some variables have means close to 0.5 while others have means that approach the extremes of either 0 or 1. Variables with means closer to 0 or 1 represent the type of questions on surveys where respondents are more homogeneous in their opinions.
Simulations with survey data
While the purely mathematical exercise of simulations with synthetic data can be useful for developing basic theoretical expectations, the concern that the synthetic data do not adequately represent actual survey data is a serious limitation. To address this, we also conducted simulations with actual survey data to understand the impact of various parameters in real-world conditions. We used the 2012 American National Election Study and the Arab Barometer Wave III Lebanon surveys as the basis for additional simulations. These are two high-quality surveys that based on Kuriakose and Robbins’ threshold are assumed to be free of duplication. The two surveys have large sample sizes, with between 1,000 and 2,000 cases, and lengthy questionnaires, with roughly 200 or more substantive questions.1 The size of the surveys allows us to randomly select subsamples of questions and respondents from all questions and all respondents available. By doing so, we are able to vary key parameters in a semi-controlled environment using real-world survey data where the variables and respondents are now correlated. We excluded any questions for which over 10% of respondents have missing values.
Using this method, we also evaluated the impact of the number of response options in the questions using the ANES. We conducted similar simulations to those described above varying the number of questions and the sample size, but also randomly sampled variables based on their number of response options. We did this for overlapping segments of the response options range (e.g. variables with two to four response options, with three to five response options, etc.).
Evaluation of high-quality, U.S. survey data
Finally, we explore in more depth the impact of population homogeneity on the percentage of high matches. The underlying homogeneity of a population will be affected by the content of the survey – respondents are more likely to agree on some issues than other issues – and the natural agreement within subgroups of the population – some groups of respondents are more likely to agree with each other than other respondents.
For the evaluation of the content of the survey, we compared the percentage of high matches in domestic survey data from Pew Research Center to the theoretical expectations derived from the simulations based on the ANES. The real-world survey data we used is like the ANES in that there is little concern about the presence of falsified data, since the surveys are random-digit dial telephone surveys with centralized and live interviewer monitoring and collection of detailed contact data. They are unlike the ANES in that they have shorter questionnaires on a few concentrated topics. For the analysis, we reviewed four political surveys conducted by Pew Research Center in 2014 and 2015, including the large 2014 Political Polarization and Typology survey, an October 2014 election survey and two typical monthly surveys from 2015 that covered major political issues in the news at the time. The content covered across all of these surveys varies considerably, but the monthly surveys tend to concentrate on a few major news-worthy issues.
To understand the impact of population homogeneity among subgroups on the presence of high matches, we used the four political surveys described above as well as the 2014 Religious Landscape Study conducted by Pew Research Center, which is a nationally representative telephone survey of 35,071 U.S. adults with 41 substantive questions asked of all respondents. Data collection for the Landscape Study was conducted by three different research firms. In general, the American population is very diverse. But it also includes distinct pockets of more homogeneous subgroups with respect to different issues covered by each survey. The political surveys ask about a range of issues that polarize Democrats and Republicans, enabling us to evaluate how the percentage of high matches differs among partisan groups. The Religious Landscape Study includes, among other things, questions on religious identity and beliefs and practices. The large size of the survey allows us to analyze religious groups that are relatively small, homogeneous segments of the population, such as Mormons, with a robust sample size.
III.b Results: Simulations with Synthetic Data
We conducted simulations using synthetic data to generate initial theoretical expectations for what we should see in real-world survey data when it comes to the presence of high matches. Our first simulation extended the approach taken by Kuriakose and Robbins by keeping the variable means at 0.5, but testing variations on the number of questions and number of respondents included in each survey. For each simulated survey, we calculated the proportion of respondents classified as a high match, meaning the respondent matches another respondent on more than 85% of questions. Each combination of sample size and number of respondents was replicated 1,000 times.
When the variable means are fixed at 0.5, there are no respondents classified as a high match in any of the simulations with 100 or more questions, and only a handful meet the 85% threshold with 40 or 60 questions, regardless of the sample size. Only at 20 questions do a substantial percentage of respondents qualify as high matches, with a median of 10% when the sample size is 500 and a median of 40% when the sample size is 2,500. The results for the datasets with 100 variables and 1,000 respondents are consistent with Kuriakose and Robbins’ simulation. The graph for all of these simulations is in Appendix A.
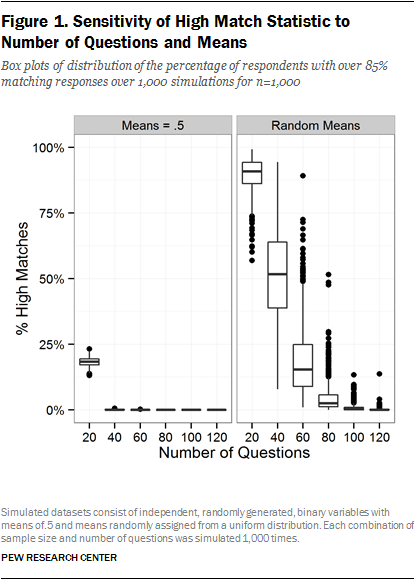
However, when the variable means are allowed to vary randomly, a very different picture emerges. Figure 1 compares the results of these simulations when the sample size is set at 1,000 (Appendix A has graphs for all simulations). When the means vary across questions, the proportion of respondents that qualify as high matches increases dramatically. With 20 questions, the median survey had 91% high matches, while at 60 questions, the median survey had 15%. Even at 120 questions, over one-third of the simulations have high matches, ranging from 2% to 14%.
In their simulations, Kuriakose and Robbins tested a single combination of survey parameters – 1,000 respondents and 100 binary questions with means implicitly fixed at 0.5. Our additional simulations demonstrate that their results are highly sensitive to their choice of parameters. Surveys with fewer questions, larger samples or items with high levels of respondent agreement can all be expected to produce respondents who are more similar to one another. Furthermore, these synthetic data simulations remain highly unrealistic. Questions only have two response categories and they are all independent. This is not an adequate basis for generating hypotheses about what should be expected in practice, as questions are often correlated with one another and frequently include more response options.
III.c Results: Simulations with Actual Survey Data
In order to replicate more realistic survey conditions while still retaining control over the features of the survey, we conducted additional simulations using data from the 2012 ANES pre-election survey and the Arab Barometer Wave III Lebanon survey by randomly selecting sets of questions and respondents in varying combinations. These are surveys that include many questions with more than two response options and where the correlations between questions and similarities between respondents reflect those of actual populations.
First, we used the ANES data to assess how the share of high matches in a survey is related to the number of response categories in survey questions. We did this by performing simulations that varied the number of response options per question in addition to the number of questions and the sample size. Rather than randomly select from all possible questions in a survey, these simulations randomly select from questions that have two to four, three to five, four to six or five to seven response categories. Figure 2 contains the results for the datasets with 1,000 respondents.
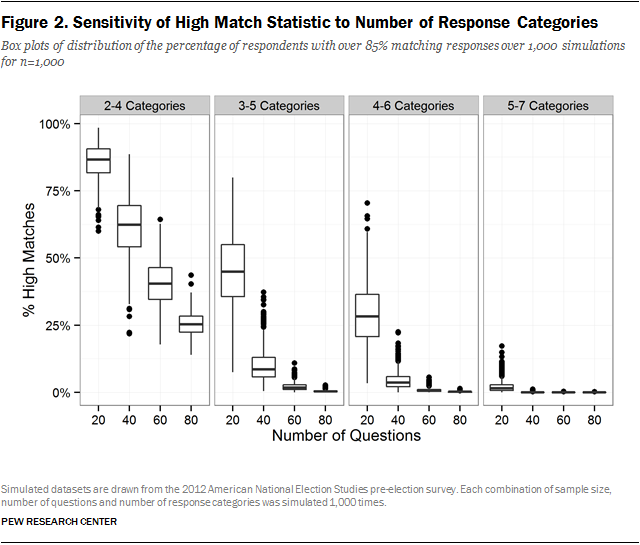
As with the synthetic simulations, the number of questions and respondents continue to have an impact on the percentage of high matches. We also find that as the number of response options decreases, the percentage of high matches increases considerably. As expected, this also varies with the number of questions and the sample size, but when there are only two to four response options, the median percentage of high matches ranges from 87% when there are 20 questions to 25% when there are 80 questions. This confirms what we would expect intuitively – that the proportion of high matches in a survey will be sensitive not only to the number of questions, but also to the types of questions included in a survey. Most surveys will include a mix of questions with different numbers of response options ranging from few to many. For any given survey, the details of that distribution are another important determinant of the number of high matches that would be present.
The results for the two to four response options also represent a significant departure from the results obtained with the synthetic data simulations. With the synthetic data, when the number of respondents is 1,000, the variable means are fixed at 0.5, the number of questions is 80 and the number of response options is two, there are no high matches under these conditions. Under the same conditions in the ANES (with the exception of 0.5 means), the median percentage of high matches across 1,000 replications is 25%. This comparison re-emphasizes that, contrary to Kuriakose and Robbins’ assertion, their simulations are not a conservative estimate of the percentage of high matches in real-world survey data. Furthermore, this comparison suggests that a threshold based on simulations with synthetic data is not relevant for what we should see in real-world data.
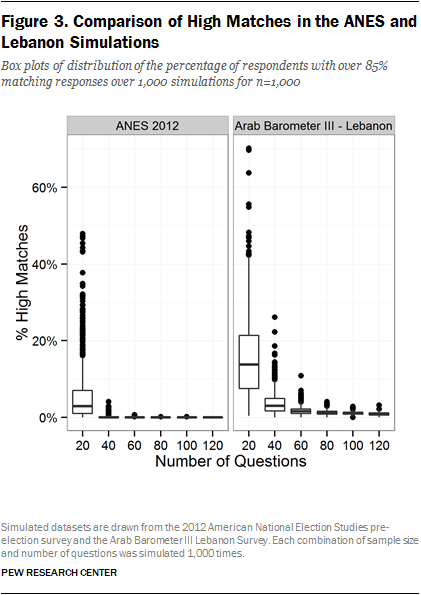
We also conducted comparable simulations with the Arab Barometer Wave III Lebanon survey which was fielded in 2013. The purpose of this comparison is to evaluate the presence of high matches under various conditions in a nonfalsified dataset that surveyed a different population. Figure 3 contains a comparison of simulations drawn from the ANES and the Arab Barometer surveys with a sample size of 1,000 and varying the number of questions between 20 and 120 questions.2 In this set of simulations, the number of response options in the questions is allowed to vary.
We see very different distributions of high matches in the ANES and Arab Barometer surveys. Whereas the percentage of high matches in the ANES is nearly zero for all but the 20-question condition, the Lebanon simulations reflect a higher proportion of high matches, even at 100 or 120 questions. This indicates that the probability of any two respondents matching on over 85% of questions depends not just on the number of respondents or the number of questions, but also on the particular survey content and the population being surveyed. In other words, a threshold based on the ANES and other surveys conducted in the United States does not necessarily generalize to other countries. Even within a single country, there is no a priori reason to believe the distribution of high matches observed on one survey should be similar to another survey with different content.
III.d Results: Pew Research Center U.S. Survey Data
In this next section, we evaluate the impact of population homogeneity – due either to content or subgroup agreement – on the percentage of high matches using domestic surveys from Pew Research Center. The advantages of this phase of the research are twofold. One, we can evaluate the variation in the percentage of high matches under a variety of real-world conditions, and compare these results with the theoretical expectations derived from the simulations with the synthetic data and the ANES data. Two, since these surveys are high-quality telephone surveys with live interviewer monitoring and collection of detailed contact data we have little reason to suspect the presence of data falsification. Therefore the differences we see between the theoretical expectations and the real-world data are more likely explained by population homogeneity than by fraudulent data.
Evaluating the impact of questionnaire content
The four political surveys we analyzed have a relatively modest number of questions asked of the entire sample (about 30 to 50). The number of respondents ranges between 1,500 and 2,000 for the three monthly surveys, and is 10,000 for the Polarization study. The table reports the percentage of respondents that match another respondent on more than 85% of substantive variables for each of the four surveys analyzed, along with the parameters for each survey, including number of respondents, number of questions and percentage of questions with five or more response options.
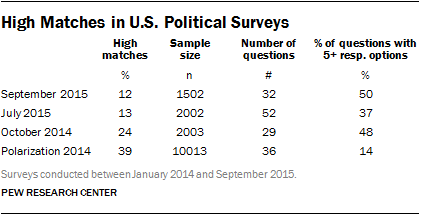
Overall, across the four surveys, there are substantial percentages of high matches in the full sample, ranging from 12% in the September 2015 survey to 39% in the 2014 Polarization study. In large part, the number of high matches is likely driven by the low number of questions typically asked, the relatively low number of response options and the large sample sizes, especially in the Polarization study.
Nonetheless, in the July 2015 survey with 52 questions and 2,002 respondents, we find 13% of the sample is a high match. In the simulations with the synthetic data with 0.5 means, as well as the simulations with the ANES data, the median percentage of high matches across 1,000 replications with these conditions is 0. Given that there is little concern about the presence of data falsification in the July 2015 survey, this comparison reveals that the content and context of the questionnaire can have a significant impact on the percentage of high matches in a dataset. The findings also suggest that a single threshold for the maximum percent match statistic based on simulations with synthetic data and the ANES may not be appropriate.
Evaluating the impact of population homogeneity
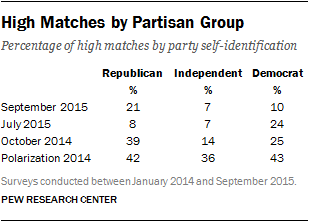
To understand the effect of population homogeneity on the percentage of high matches in a dataset due to subgroup agreement, we evaluated how the percentage of high matches varies by partisan group in the four political surveys. The table shows the percentage of respondents in each partisan group for each survey that is a high match. People who identify with a political party tend to be more polarized and firm in their political beliefs than those who say they are independent, and therefore we expect higher levels of homogeneity among partisans. Indeed, we find that Republicans and Democrats tend to have higher percentages of high matches than independents, though the exact percentage varies by survey. We also find variation in the percentage of high matches by partisan group across surveys that is consistent with the content on and the political context of the survey. For example, the 2014 election led to widespread gains for the Republican Party. In the October 2014 election-focused survey, Republicans had the highest percentage of high matches, indicating a high level of homogeneity within the group heading into the election.
We also investigated the impact of population homogeneity using the 2014 Religious Landscape Study, which is a very large survey of 35,071 respondents covering several issues, including religious identity and beliefs. Since the percent match tool developed by Kuriakose and Robbins is unable to process a dataset of this size, we evaluated 10 random samples from the dataset of roughly 1,000 respondents each to get a sense for the number of high matches overall. The highest percentage of respondents that match another respondent on more than 85% of the substantive variables in any of the 10 random samples is 6%. In addition, we analyzed random samples of approximately 1,000 respondents for each of the three fieldhouses that conducted the survey. Each fieldhouse exhibits relatively similar percentages of high matches, ranging between 4% and 7%. This bolsters the argument that this data is not falsified.
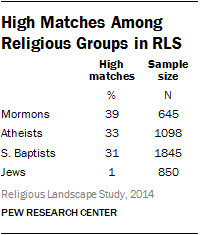
Once we look at specific religious subgroups, however, the percentage of high matches increases considerably. We analyzed four religious subgroups separately using the same set of 41 questions. In this set of 41 questions, 54% of the questions have five or more response options. The table lists the percentage of high matches and number of respondents for each of the four different religious groups. Mormons have the highest percentage, with 39% of respondents that are a high match. Atheists have 33% high matches and Southern Baptists have 31% high matches. On many religion surveys, these three religious groups tend to be more homogeneous in their beliefs and practices than other American religious groups. Jews, on the other hand, have very few high matches (1%). As with the partisan differences on the political survey, the religious differences on this survey suggest that homogeneity within specific populations can drive up the percentage of high matches in the dataset without indicating the presence of falsified data.
The findings from both the political surveys and the RLS indicate that even in high-quality datasets in the U.S. conducted under rigorous quality controls, there is considerable variation in the percentage of high matches. This variation is driven in part by the topics covered by the survey and the homogeneity of the population, or subgroups of the population, on those topics. The ANES surveys are conducted with a very diverse population using a varied and long questionnaire. The findings in this section, along with the results of the simulations discussed earlier, suggest that it is inappropriate to apply a threshold based on analysis of the ANES to other populations and other types of questionnaires.
IV. Discussion
Kuriakose and Robbins assert in their paper that two respondents that match on a high percentage of questions should be a rare occurrence in valid data, and that the presence of respondents that match on more than 85% of questions is an indication of falsification. They make their case for this conclusion based on a review of public opinion literature, simulations with synthetic data and analysis of data from the American National Elections Study and the General Social Survey.
However, the assumptions underpinning their argument – and the datasets they used to develop their threshold – raise some serious questions about whether high matches in a dataset are a definitive indicator of falsification or whether high matches may result from various permutations of the characteristics of the survey. The goal of this paper was to understand the conditions under which high matches may be present in valid survey data.
Using synthetic simulations as well as high-quality domestic and international datasets, we show that the percentage of high matches varies widely across datasets and is influenced by a variety of factors. The characteristics of a survey, such as the number of questions, the number of response options, the number of respondents, and the homogeneity of the population, or subgroups therein, all affect the percentage of high matches in a dataset. The results show that it is possible to obtain any value of the maximum percent match statistic in nonfalsified data, depending on the survey parameters. Thus, setting a threshold for the statistic and applying it uniformly across surveys is a flawed approach for detecting falsification. In fact, eliminating respondents from a dataset based on this measure may introduce selection bias into survey data and serve to reduce data quality, rather than improve it.
[spatial homogeneity]
Nonetheless, Kuriakose and Robbins are taking part in an important discussion about how to improve detection methods for data falsification. The use of new technologies for face-to-face surveys, such as devices for computer-assisted personal interviewing (CAPI), present many new possibilities when it comes to ensuring data quality through prevention and detection methods. CAPI makes it much easier to collect data on important aspects of the survey process beyond substantive data (i.e. paradata or auxiliary data). These data can be converted from a byproduct of the survey into a primary analytical tool for assessing survey quality.
One especially promising innovation is the measurement of time throughout the survey in face-to-face studies. This includes the overall length of a survey, from start to finish, but also the time it takes to go through sections of the questionnaire, or to answer a specific question. The measurement of section timings can be used to evaluate whether the respondent or interviewer may have had unusual difficulties with a particular section, or whether the interviewer may not have taken the appropriate amount of time to ask certain questions. Another interesting avenue for detection of falsified data through CAPI is the use of audio recordings at random points in the interview. This allows the researcher to review whether the respondent and/or interviewer were speaking and whether the same respondent is answering the questions throughout the survey. Other aspects that could be efficiently embedded in a computer-assisted interviewing environment are within household selection procedures, as well as the collection of geographical tracking information. The community is still exploring how to use this kind of information in the most effective way.
Still, even these new approaches would need to be evaluated along with a variety of other indicators. Any ex-post statistical analysis of data has its limitations. Thus, researchers should try to involve vendors in the assessment of the quality of the data.
Engaging vendors in the assessment of suspicious data provides two benefits. First, it helps to reduce the information gap created by the principal-agent dilemma by allowing researchers to learn something about the specific conditions under which interviewers were operating. This will contribute to the overall interpretation of the data itself, but will also help with the evaluation of suspicious data patterns. Second, involving vendors closes the circle of prevention and detection and places the whole assessment in the wider context of quality assurance. The involvement of vendors allows the vendor and the researcher to evaluate and learn for future projects. The findings from detection measures should inform the design and structure of future questionnaires, lead to new approaches to incentivize interviewers, and assist with the development of new prevention and detection methods.


