
The bulk of the analysis in this report stems from a general public survey conducted by telephone with a national sample of adults (18 years of age or older) living in all 50 U.S. states and the District of Columbia. The results are based on 2,002 interviews (801 respondents were interviewed on a landline telephone and 1,201 were interviewed on a cellphone). Interviews were completed in English and Spanish by live, professionally trained interviewing staff at Princeton Data Source under the direction of Princeton Survey Research Associates International from Aug. 15 to Aug. 25, 2014.
Survey Design
A combination of landline and cell random digit dial (RDD) samples was used to reach a representative sample of all adults in the United States who have access to either a landline or cellular telephone. Both samples were disproportionately stratified to increase the incidence of African American and Hispanic respondents. Within each stratum, phone numbers were drawn with equal probabilities. The landline samples were list-assisted and drawn from active blocks containing one or more residential listings, while the cell samples were not list-assisted but were drawn through a systematic sampling from dedicated wireless 100-blocks and shared service 100-blocks with no directory-listed landline numbers. Both the landline and cell RDD samples were disproportionately stratified by county based on estimated incidences of African American and Hispanic respondents.
Margin of Sampling Error
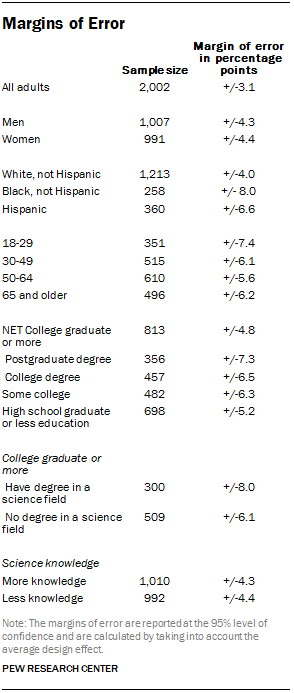
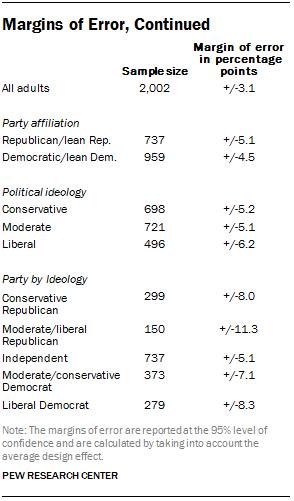
Statistical results are weighted to correct known demographic discrepancies, including disproportionate stratification of the sample. The margins of error table shows the unweighted sample sizes and the error attributable to sampling that would be expected at the 95% level of confidence for different groups in the survey.
The survey’s margin of error is the largest 95% confidence interval for any estimated proportion based on the total sample – the one around 50%. For example, the margin of error for the entire sample is ±3.1 percentage points. This means that in 95 out of every 100 samples drawn using the same methodology, estimated proportions based on the entire sample will be no more than 3.1 percentage points away from their true values in the population. Sampling errors and statistical tests of significance used in this report take into account the effect of weighting. In addition to sampling error, one should bear in mind that question wording and practical difficulties in conducting surveys can introduce error or bias into the findings of opinion polls.
Interviewing Procedures
All interviews were conducted using a Computer Assisted Telephone Interviewing (CATI) system, which ensures that questions were asked in the proper sequence with appropriate skip patterns. CATI also allows certain questions and certain answer choices to be rotated, eliminating potential biases from the sequencing of questions or answers.
For the landline sample, half of the time, interviewers asked to speak with the youngest adult male currently at home and the other half of the time asked to speak with the youngest adult female currently at home, based on a random rotation. If no respondent of the initially requested gender was available, interviewers asked to speak with the youngest adult of the opposite gender who was currently at home. For the cellphone sample, interviews were conducted with the person who answered the phone; interviewers verified that the person was an adult and could complete the call safely.
Both the landline and cell samples were released for interviewing in replicates, which are small random samples of each larger sample. Using replicates to control the release of the telephone numbers ensures that the complete call procedures are followed for all numbers dialed. As many as seven attempts were made to contact every sampled telephone number. The calls were staggered at varied times of day and days of the week (including at least one daytime call) to maximize the chances of making contact with a potential respondent.
Questionnaire Development
The Pew Research Center developed the questionnaire. The design of the questionnaire was informed by consultation with a number of staff at the Pew Research Center, senior staff of the American Association for the Advancement of Science (AAAS) and several outside advisers. Questionnaire development is an iterative process. A pilot study was conducted August 5-6, 2014 with 101 adults living in the continental U.S. The sample was drawn from fresh RDD landline phone numbers (n=25) and a sample of cellphone numbers from respondents interviewed in recent RDD omnibus studies (n=76). The tested questionnaire included a number of open-ended questions to gauge what respondents had in mind when thinking about the positive and negative effects of science on society. As a final step, a traditional pretest was conducted Aug. 12, 2014, with 24 adults living in the continental U.S. The sample was drawn from fresh RDD landline phone numbers and a sample of cellphone numbers from respondents interviewed in recent RDD omnibus studies. The interviews were conducted in English under the direction of Princeton Survey Research Associates International. The interviews tested the questions planned for the study questionnaire in the full survey context. The final questionnaire lasted about 22 minutes, on average.
Weighting
Several stages of statistical adjustment or weighting are used to account for the complex nature of the sample design. The weights account for numerous factors including (1) the different, disproportionate probabilities of selection in each strata, (2) the overlap of the landline and cell RDD sample frames and (3) differential nonresponse associated with sample demographics.
The first stage of weighting accounts for different probabilities of selection associated with the number of adults in each household and each respondent’s telephone status. 46 This weighting also adjusts for the overlapping landline and cell RDD sample frames and the relative sizes of each frame and each sample. Due to the disproportionately stratified sample design, the first-stage weight was computed separately for each stratum in each sample frame.
After the first-stage weight adjustment, two rounds of poststratification were performed using an iterative technique known as raking. The raking matches the selected demographics to parameters from the U.S. Census Bureau’s 2012 American Community Survey data.47 The population density parameter was derived from 2010 census data. The telephone usage parameter came from an analysis of the July-December, 2013 National Health Interview Survey. 48 Raking was performed separately for those asked each form of the questionnaire using sample balancing, a special iterative sample weighting program that simultaneously balances the distributions of all variables using a statistical technique called the Deming Algorithm. The raking corrects for differential nonresponse that is related to particular demographic characteristics of the sample. This weight ensures that the demographic characteristics of the sample closely approximate the demographic characteristics of the population.
The first round of raking was done individually for three racial/ethnic groups (Hispanics, non-Hispanic blacks, and all other non-Hispanics). The variables matched to population parameters for each race/ethnicity group were gender, age, education and region. The variables matched to population parameters for Hispanic respondents also included nativity (U.S. born versus foreign born). The variables for other non-Hispanic respondents also included race (white race versus some other or mixed race).
A second round of poststratification raking was performed on the total sample for each form. Each form was raked to the following demographic variables: gender by age, gender by education, age by education, census region, race/ethnicity, population density and household telephone status (landline only, cellphone only, or both landline and cellphone).
Measuring Science Education
The survey also included a measure of science training at the college level or above. Survey respondents who had completed at least a four-year college degree were asked whether or not they held a degree in a scientific field. Responses among those holding a degree in a science field as compared to those with degrees in some other field are shown throughout the report. This factor was not included in multivariate regression analyses.
Measuring Science Knowledge
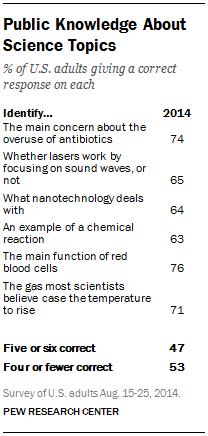
The survey questionnaire included six questions designed to measure factual knowledge about a range of science topics. The set included five multiple-choice questions and one true-false question. Respondents were asked to identify the main concern about the overuse of antibiotics, the mechanism behind lasers, that nanotechnology deals with extremely small things, an example of a chemical reaction, the main function of red blood cells, and the gas most scientists believe cause the average temperature to rise. The set of questions included a mix of biological and physical science topics; some involved aspects of science that are likely to come up in adult life (e.g., the main concern about the overuse of antibiotics) or in following the news (e.g., the gas most scientists believe cause temperatures in the atmosphere to rise). A majority of adults provided a correct answer to each of the six questions. The alpha reliability coefficient for the scale of six items is 0.62.49 Those who answered five (20%) or all six (27%) questions correctly were classified as having more science knowledge (47%) and compared with those who answered fewer questions correctly (53%).50
About the Multivariate Regression Analyses
The regression analyses are based on the full sample of U.S. adults in the survey who provided a response on each topic. The analysis is based on the weighted sample, thus adjusting for differences in the probability of selection and nonresponse differences across groups.51 Results are based on 0.05 level of statistical significance. The dependent variable omits respondents who said don’t know to that question. The independent variables used in each analysis are as follows: gender (women compared with men); race and ethnicity (non-Hispanic blacks, Hispanics and other or mixed race as compared with non-Hispanic whites); age; education (having a postgraduate degree, college degree or some college as compared with those having a high school degree or less education); science knowledge (those with more as compared with less knowledge about science based on the index described above); party affiliation (Republicans and leaning Republicans, those with no affiliation or leaning lean toward either party as compared with Democrats and leaning Democrats); political ideology (conservatives, moderates as compared with liberals). Additional analyses included religious affiliation and frequency of worship attendance along with the variables listed above.52 A detailed report on religious group differences related to science attitudes is forthcoming. And, for several issues, separate analyses included the variables described above in addition to one or two other relevant judgments. The total number of respondents in each analysis ranges between roughly 1,614 (when religious factors are included in the model) to a possible maximum of 2,002 respondents, depending on the number of respondents missing responses to either an independent variable in the model or to the dependent variable. Further details about the regression results reported here are available upon request. 53 The dataset will be publicly available for secondary analysis through the Pew Research Center website in the coming months.
The figures shown in the multivariate analysis tables are the difference in the predicted probability of the dependent measure when the independent variable is at its maximum value minus when it is at its minimum value, with other independent variables held at their means. For these independent variables the minimum value is zero indicating that a characteristic such as being African American is not present and the maximum value is one indicating that a characteristic such as being African American is present. The independent variable for age was re-scaled to range from 0 to 1; these values correspond to a minimum age of 18 and a maximum of 97. For the ordered logistic regression model, the figures shown are the average changes in predicted probability (or absolute value, thereof) across the set of categories in the dependent measure (the frequency of looking for GM food labels).
Each conceptual factor (gender, race and ethnicity, age, education and science knowledge, party and ideology, and religion) is classified as having a strong, medium or weak effect in explaining people’s views across the set of science-related topics. Some of these conceptual factors are based on a set of several independent variables. For example, the effect of education and knowledge is classified based on a set of four independent variables. Gender and age are based on a single independent variable. For the party and ideology factor, the set of variables used to classify the factor is based on Republican/lean Republican, conservative and moderate variables, irrespective of findings for no party affiliation or lean. Religion is based on a set of variables used to classify religious affiliation as well as variables to classify frequency of religious service attendance.54
Strong factors entail at least one statistically significant independent variable in the set, which is estimated to change the predicted probability of people’s views by at least one half of a standard deviation in that independent variable. Medium factors are statistically significant predictors where the maximum change in predicted probability is less than one half of a standard deviation in the independent variable. If no independent variable in that set meets the criteria for a strong or medium effect, the factor is classified as having a weak effect.55
These classifications are designed to help readers assess the broader patterns underlying public attitudes across a large set of topics, but they are, of course, dependent on the criteria used. Note that judging the relative effect size against the standard deviation of the independent variable means that variables with more variability such as gender and science knowledge require a change in predicted probability of about 0.24 to be classified as strong while that for those holding a postgraduate degree would need to be about 0.16 or higher.
