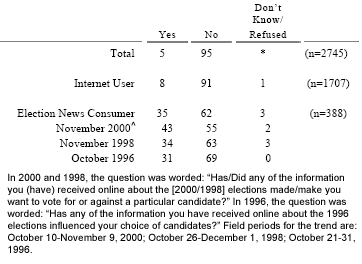
This report is based on the findings of a daily tracking survey on Americans’ use of the Internet. The results in this report are based on data from telephone interviews conducted by Princeton Survey Research Associates between October 30 and November 24, 2002, among a sample of 2,745 adults, 18 and older. For results based on the total sample, one can say with 95% confidence that the error attributable to sampling and other random effects is plus or minus 2 percentage points. For results based Internet users (n=1,707), the margin of sampling error is plus or minus 2.5 percentage points. For results based on those who go online for election news (n=388), the margin of sampling error is plus or minus 5 percentage points. In addition to sampling error, question wording and practical difficulties in conducting telephone surveys may introduce some error or bias into the findings of opinion polls.
The sample for this survey is a random digit sample of telephone numbers selected from telephone exchanges in the continental United States. The random digit aspect of the sample is used to avoid “listing” bias and provides representation of both listed and unlisted numbers (including not-yet-listed numbers). The design of the sample achieves this representation by random generation of the last two digits of telephone numbers selected on the basis of their area code, telephone exchange, and bank number.
New sample was released daily and was kept in the field for at least five days. This ensures that complete call procedures were followed for the entire sample. Additionally, the sample was released in replicates to make sure that the telephone numbers called are distributed appropriately across regions of the country. At least 10 attempts were made to complete an interview at every household in the sample. The calls were staggered over times of day and days of the week to maximize the chances of making contact with a potential respondent. Interview refusals were recontacted at least once in order to try again to complete an interview. All interviews completed on any given day were considered to be the final sample for that day.
Non-response in telephone interviews produces some known biases in survey-derived estimates because participation tends to vary for different subgroups of the population, and these subgroups are likely to vary also on questions of substantive interest. In order to compensate for these known biases, the sample data are weighted in analysis. The demographic weighting parameters are derived from a special analysis of the most recently available Census Bureau’s Current Population Survey (March 2001). This analysis produces population parameters for the demographic characteristics of adults age 18 or older, living in households that contain a telephone. These parameters are then compared with the sample characteristics to construct sample weights. The weights are derived using an iterative technique that simultaneously balances the distribution of all weighting parameters.
Following is the full disposition of all sampled telephone numbers:
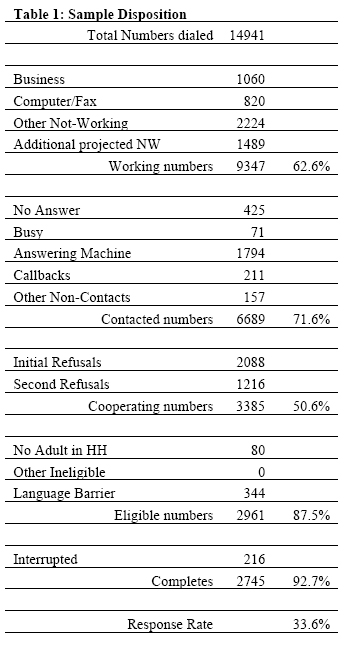
PSRA calculates a response rate as the product of three individual rates: the contact rate, the cooperation rate, and the completion rate. Of the residential numbers in the sample, 71.6 percent were contacted by an interviewer and 50.6 percent agreed to participate in the survey. Eighty-eight percent were found eligible for the interview. Furthermore, 92.7 percent of eligible respondents completed the interview. Therefore, the final response rate is 33.6 percent.
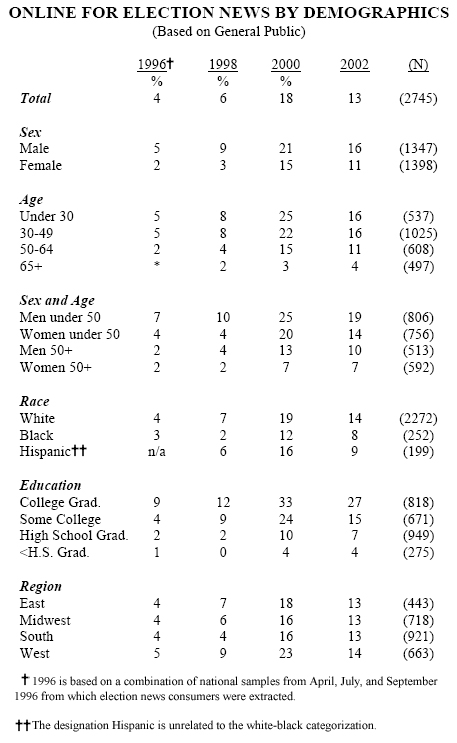
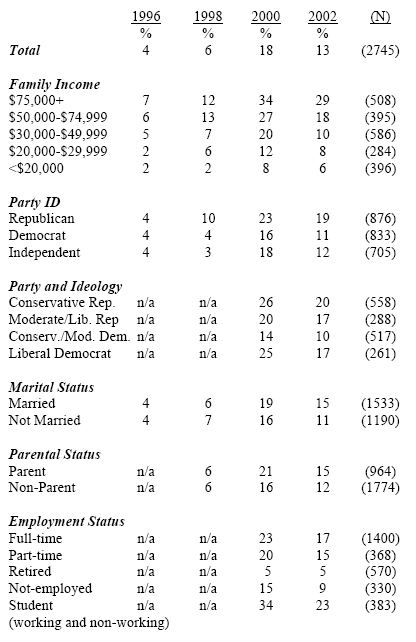
Reading this Table: This table shows the percentage of each demographic group that goes online for election news. For example, the first column shows that 4% of the general public went online for election news in 1996, 5% of men went online for election news, while 2% of women went online for election news.
This table shows the percentage of each demographic group that goes online for election news. For example, the first column shows that 4% of the general public went online for election news in 1996, 5% of men went online for election news, while 2% of women went online for election news.
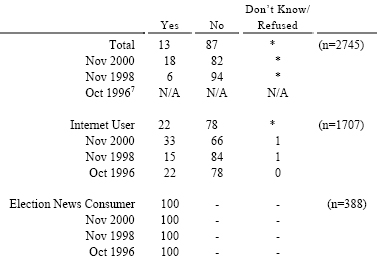
Question: Have you gone/Did you ever go online to get news or information about the 2002 mid-term elections?
Topline
PEW RESEARCH CENTER FOR THE PEOPLE AND THE PRESS
THE PEW INTERNET & AMERICAN LIFE PROJECT
THE GEORGE WASHINGTON UNIVERSITY INSTITUTE
FOR POLITICS, DEMOCRACY, AND THE INTERNET
NOVEMBER 2002 CAMPAIGN AND INTERNET
FINAL TOPLINE
October 30- November 24, 2002
N=2,745
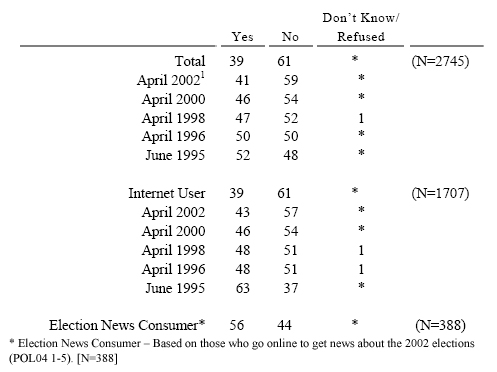
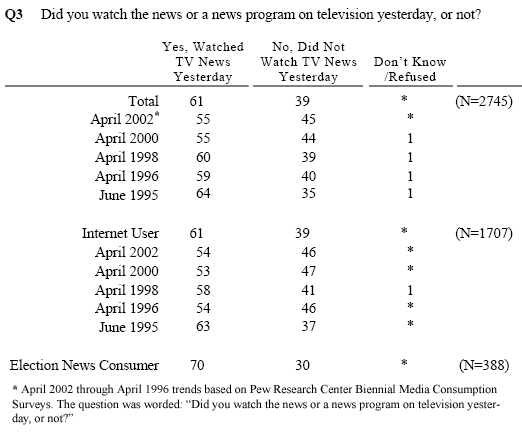
Q2 Now I have a few questions about whether you spent any time reading or watching the news yesterday. Just thinking about yesterday, did you get a chance to read a daily newspaper, or not?1
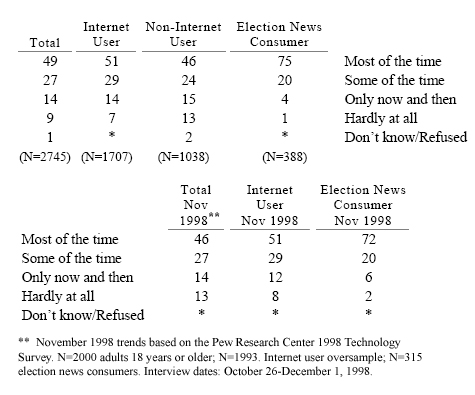
POL01 Some people seem to follow what’s going on in government and public affairs most of the time, whether
there’s an election or not. Others aren’t that interested. Would you say you follow what’s going on in
government and public affairs (INSERT)?
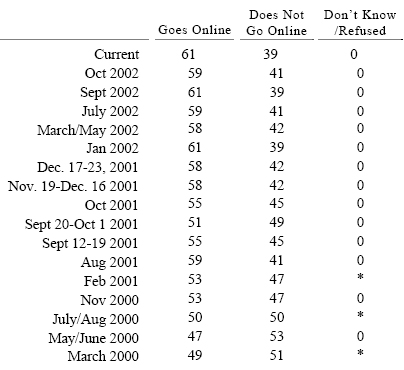
Q6 Do you ever go online to access the Internet or World Wide Web or to send and receive email?
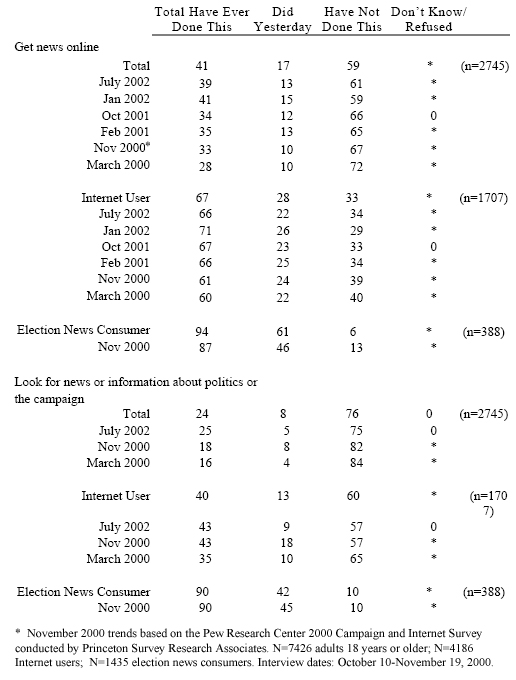
WEB1 Please tell me if you ever do any of the following when you go online. Do you ever… Did you happen to do this yesterday, or not?
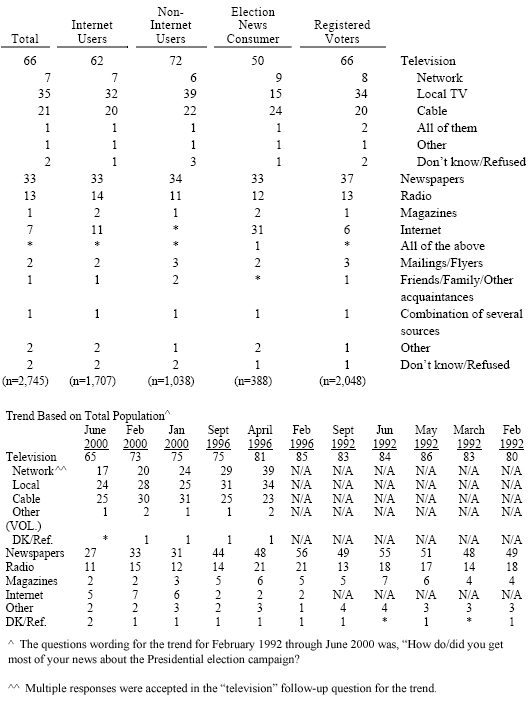
Q17 How do/did you get most of your news about the election campaigns in your state and district? From television, from newspapers, from radio or from magazines or from the Internet? (Multiple Response)
Q17b Did you get most of your news about the election campaigns from network TV news, from local TV news, or from cable news networks such as CNN or MSNBC?
POL03 Have you gone/Did you ever go online to get news or information about the 2002 mid-term elections?
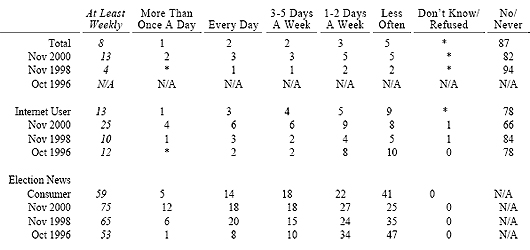
POL04 How often do you go online to get news about the elections… more than once a day, everyday, 3-5 days per week, 1-2 days per week, or less often?
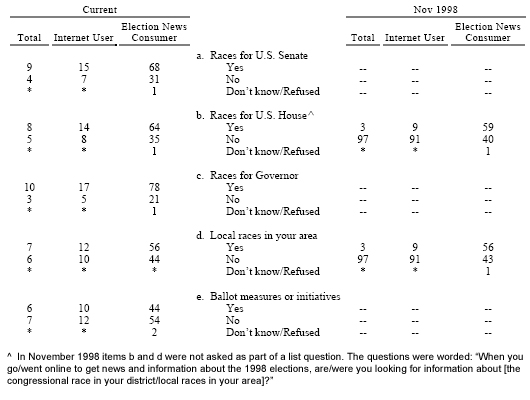
POL05 Now, I’d like to ask about what types of campaigns and elections you go online to look for information about. First, do you go online to look for information about (INSERT)?
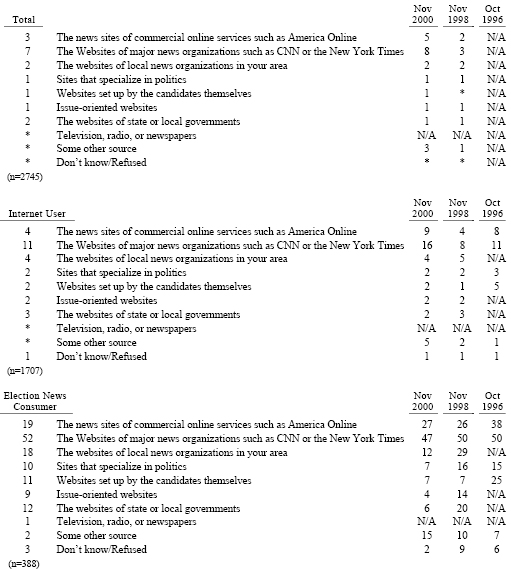
POL06 Where do you go most often for news and information about the 2002 mid-term elections? (Multiple Response)
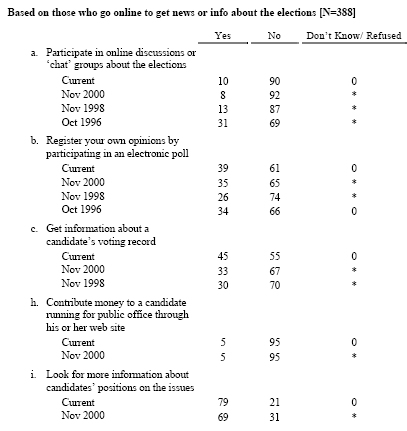
POL08 When you go online to get information about the elections, do you ever do any of the following things? First, do you ever (INSERT)?
POL02 Some people go online for campaign news because they are very interested in politics and enjoy following it. Others don’t enjoy politics, but they keep up with it because they feel it’s their duty to be well-informed. Which view comes closer to your own?

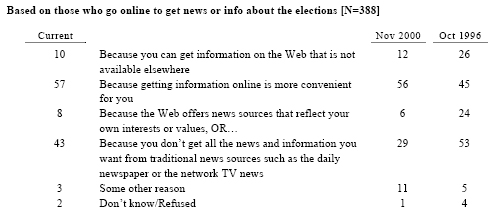
POL09 Which of the following comes closest to describing WHY you go online to get news and information about the 2002 mid-term elections? (Multiple Response)
POL09b Do you ever visit Web sites that provide information about specific issues or policies that interest you such as the environment, gun control, abortion, or health care reform?
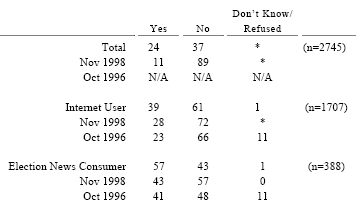
POL13 Has/Did any of the information you have received online about the 2002 mid-term elections made/make you decide to vote for or against a particular candidate?
