Note: For more recent figures on naturalized citizen eligible voters, read our 2024 post “1 in 10 eligible voters in the U.S. are naturalized citizens.”
For this report, we analyzed the detailed demographics and geographic distribution of immigrants who are eligible to vote in the 2020 presidential election. The term “eligible voters” refer to persons ages 18 and older who are U.S. citizens. The analysis is based on data from the U.S. Census Bureau’s American Community Survey and the 2000 U.S. decennial census provided through Integrated Public Use Microdata Series (IPUMS) from the University of Minnesota – and the November Voting and Registration Supplement of the Current Population Survey provided through the National Bureau of Economic Research.
Eligible voters refer to persons ages 18 and older who are U.S. citizens. They make up the voting-eligible population or electorate. The terms eligible voters, voting eligible, the electorate and voters are used interchangeably in this report.
Voter turnout refers to the number of people who say they voted in a given election.
Voter turnout rate refers to the share of eligible voters who say they voted in a given election.
The term U.S. born refers to people who are U.S. citizens at birth, including people born in the 50 U.S. states, the District of Columbia, Puerto Rico or other U.S. territories, as well as those born elsewhere to at least one parent who is a U.S. citizen.
The terms foreign born and immigrant are used interchangeably in this report. They refer to people who are not a U.S. citizen at birth – in other words, those born outside the U.S., Puerto Rico or other U.S. territories and whose parents are not U.S. citizens.
Naturalized citizens are lawful permanent residents who have fulfilled the length of stay and other requirements to become U.S. citizens and who have taken the oath of citizenship.
The terms Latino and Hispanic are used interchangeably in this report.
References to Asians, blacks and whites are single-race and refer to the non-Hispanic components of those populations.
CORRECTION (Feb. 26, 2020): An earlier version of this report incorrectly stated the U.S.-born eligible voter population in 2020, as well as its growth rate from 2000. This population grew by 18%, from 181 million in 2000 to 215 million in 2020.
More than 23 million U.S. immigrants will be eligible to vote in the 2020 presidential election, making up roughly 10% of the nation’s overall electorate – both record highs, according to Pew Research Center estimates based on Census Bureau data.
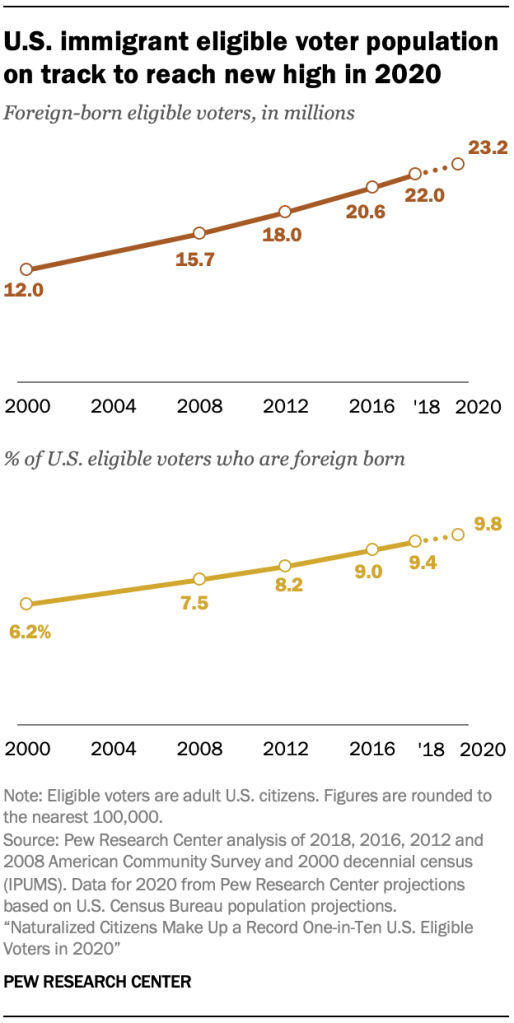
The number of immigrant eligible voters has increased steadily over the past 20 years, up 93% since 2000. By comparison, the U.S.-born eligible voter population grew more slowly (by 18%) over the same period, from 181 million in 2000 to 215 million in 2020. 1 (Immigrant eligible voters are those ages 18 and older born outside the United States who have gained U.S. citizenship through naturalization.)
The nation’s immigrant voters have diverse backgrounds. Most immigrant eligible voters are either Hispanic or Asian, though they hail from countries across the globe. Immigrants from Mexico make up the single largest group, at 16% of foreign-born voters. More than half of all U.S. immigrants (56%) live in the country’s four most populous states: California, New York, Texas and Florida. Two-thirds have lived in the U.S. for more than 20 years and 63% are proficient in English.
Growth in the foreign-born eligible voter population reflects two broad U.S. population trends. First, the number of immigrants living in the U.S. has increased steadily since 1965, when the Immigration and Nationality Act became law. Then, the nation’s 9.6 million immigrants made up just 5% of the population. Today, 45 million immigrants live in the country, accounting for about 13.9% of the population. Most are either from Latin America or Asia.
Second, a rising number and share of immigrants living in the U.S. have naturalized in recent years. Between 2009 and 2019, 7.2 million immigrants naturalized and became citizens, according to the U.S. Department of Homeland Security. In fiscal year 2018 alone, more than 756,000 immigrants naturalized.
For U.S. voters overall, immigration policy issues have risen in importance recently. Immigration also has risen as a priority the public thinks Congress and the president should address. This has been especially true for U.S. Latinos under Donald Trump’s presidency. Many of the administration’s proposed policy changes, such as expanding the U.S.-Mexico border wall and limiting legal immigration, have generated strong, polarized reactions from the public. These proposals may also affect how immigrants see their place in America and the potential role they could play in the 2020 presidential election.
Most immigrant eligible voters are Hispanic or Asian
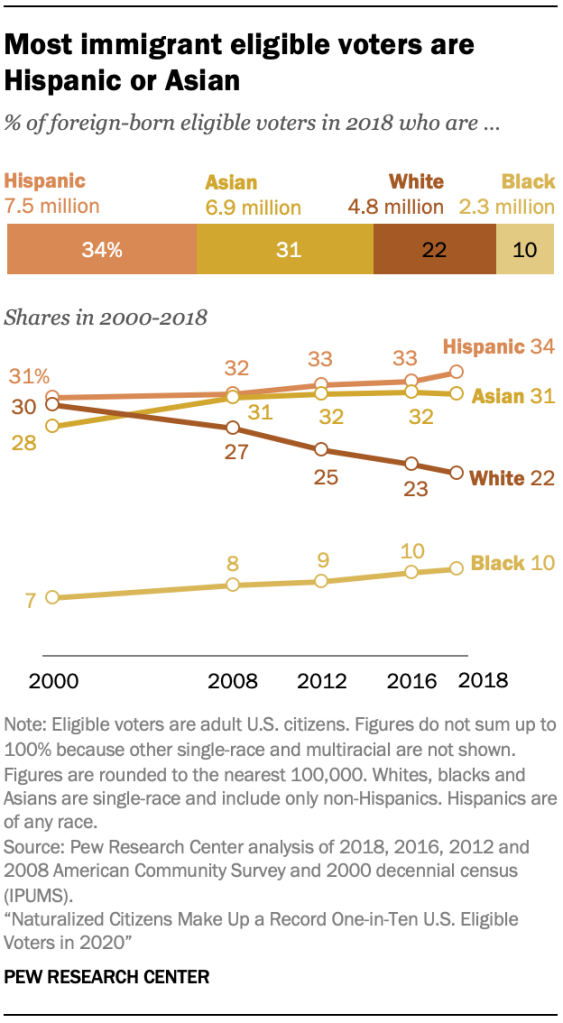
Collectively, Hispanics and Asians make up the majority of immigrants eligible to vote, according to Pew Research Center tabulations of the 2018 American Community Survey, the most recent data available for detailed demographic profiles of eligible voters.2 At 7.5 million, Hispanics account for 34% of all immigrant eligible voters in 2018, slightly up since 2000. The 6.9 million Asian immigrant eligible voters make up 31% of the foreign-born electorate, also slightly up since 2000.
White immigrant eligible voters (4.8 million) are the third largest racial and ethnic group, making up 22% of the immigrant electorate. However, nearly two decades ago, white immigrants made up 30% of foreign-born eligible voters, a higher share than that of Asians and comparable to that of Hispanics at the time. Today, black immigrant eligible voters (2.3 million) make up the smallest share of the immigrant electorate included in this analysis, though this has grown from 7% in 2000 to 10% in 2018.
Immigrants make up sizable shares of Asian and Hispanic eligible voters
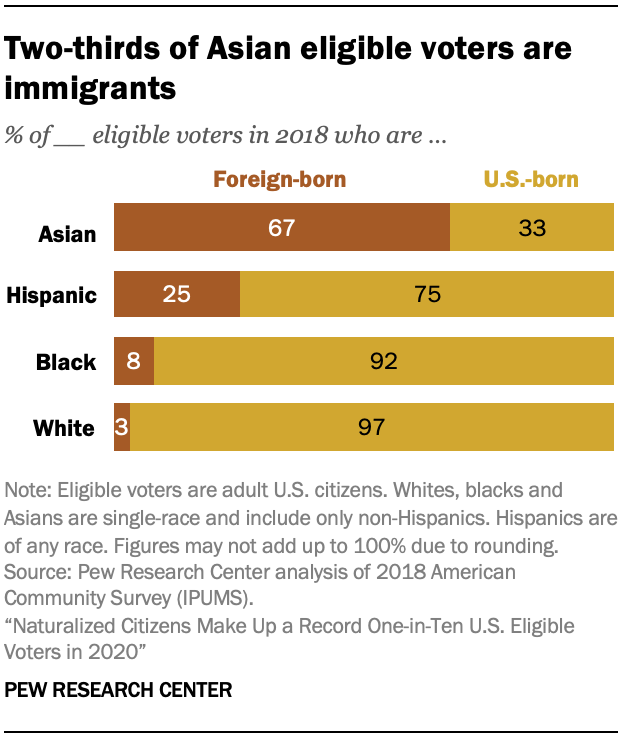
Immigrants make up far higher shares of Asian and Hispanic eligible voters than of white and black voters. Two-thirds (67%) of Asian eligible voters are immigrants, while a quarter of Hispanic eligible voters are immigrants. This somewhat reflects the overall populations of these two groups, as 77% of Asian adults and 46% of Hispanic adults are immigrants.
By contrast, immigrant shares among black eligible voters (8%) and white eligible voters (3%) are far lower. Immigrants are smaller in number among the adult populations of these groups, making up roughly 12% of black adults and 5% of white adults.
Mexican and Filipino immigrants are the largest groups among foreign-born eligible voters
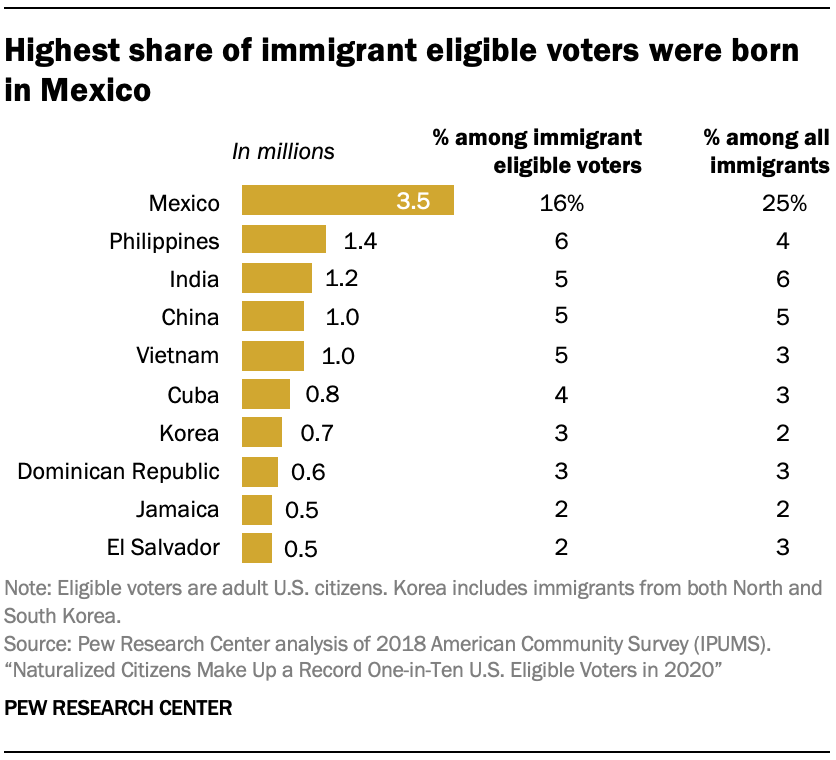
The countries of birth of immigrant eligible voters are varied and highlight the group’s diversity. There are 3.5 million immigrant eligible voters from Mexico, more than from any other country. Fewer immigrant eligible voters were born in the Philippines, India, China, Vietnam, Cuba, Korea, the Dominican Republic, Jamaica and El Salvador, in descending order. Including Mexico, these 10 birth countries account for about half of all immigrant eligible voters.
The representation of countries of birth among immigrant eligible voters is different than that among U.S. immigrants overall. For example, immigrant eligible voters born in Mexico account for 16% of all foreign-born eligible voters, far below their 25% share among all immigrants living in the U.S. By contrast, immigrant Filipino eligible voters make up 6% of foreign-born eligible voters but make up 4% of all U.S. immigrants. These gaps in representation among these immigrant populations reflect differences in naturalization rates.
U.S. citizenship eligibility and requirements
When immigrants naturalize to become U.S. citizens, they are eligible to vote in federal elections. But not all immigrants are eligible to apply for citizenship, and even if they are, there are a number of requirements and costs associated with applying that may deter some.
To become a U.S. citizen, a lawful permanent resident in most cases must:
- Be at least 18 years old.
- Have lived in the U.S. continuously for five years prior to the date of application.
- Be able to speak, write, read and understand basic English.
- Answer questions that demonstrate knowledge of U.S. government and history.
- Be a person of good moral character.
- Demonstrate attachment to the principles and ideals of the U.S. Constitution.
Some of those requirements are waived for certain groups:
- Spouses of U.S. citizens can naturalize after three years of continuous lawful permanent residence, if the sponsoring spouse has been a U.S. citizen for all three years.
- Foreign-born minor children become eligible for citizenship when their parents naturalize.
- Foreign-born minor children who are adopted by U.S. citizens are eligible for citizenship.
- Military personnel, their spouses and foreign-born minor children are eligible for expedited and overseas citizenship processing with the possibility of having some of the eligibility requirements diminished or waived. Additionally, in the case of death as a result of combat while serving in active duty, citizenship may be granted posthumously to the military member and immediate family members.
For most applicants, the total fee of processing a citizenship request is $725, which includes a $640 filing fee and an $85 biometric services fee for obtaining fingerprints. For a full list of benefits and responsibilities of U.S. citizenship, visit the USCIS website.
Immigrant voter turnout rates have trailed the U.S. born overall, but not among Latinos and Asians
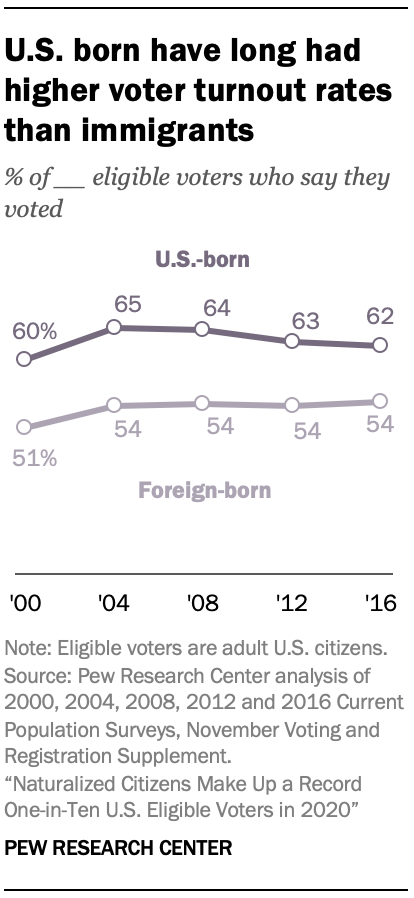
As immigrant eligible voters have grown in number since 2000, their voter turnout rates in presidential general elections have lagged those of U.S.-born voters. In 2016, 62% of U.S.-born eligible voters cast a vote, compared with 54% of foreign-born voters.
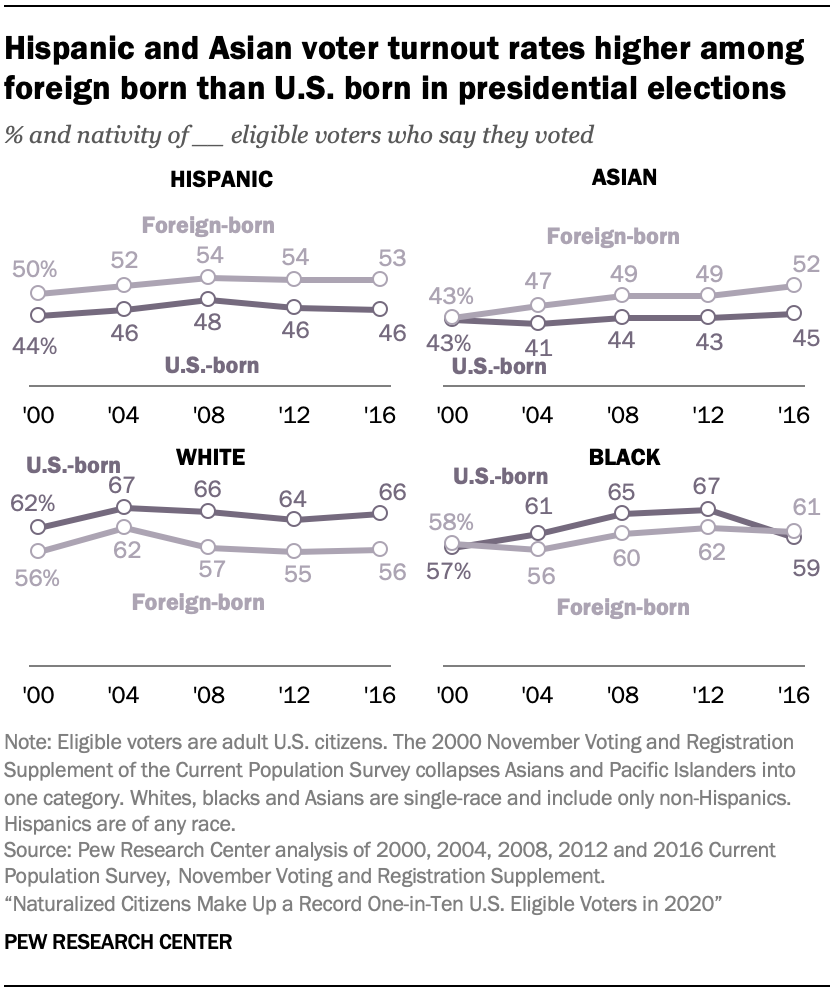
However, this voter turnout pattern is reversed among racial and ethnic groups with the largest numbers of immigrants. Among Hispanic eligible voters in 2016, about half (53%) of immigrants voted, compared with 46% of the U.S. born, a pattern that has persisted since 2000. Among Asian eligible voters in 2016, 52% of immigrants voted, compared with 45% of the U.S. born. By contrast, in 2016 among black eligible voters, the voter turnout rate for immigrants was similar to that of the U.S. born. Meanwhile, U.S.-born white eligible voters have outpaced white foreign-born eligible voters in turnout rates, with the gap widening since the 1990s.
Among immigrant eligible voters, voter turnout rates of Hispanics and Asians trail those of white and black Americans, mirroring a pattern seen among all voters. In 2016, 53% of Hispanic immigrants and 52% of Asian immigrants who were eligible to vote said they did so, compared with 61% of black immigrant and 56% of white immigrant eligible voters.
Immigrant voters and the 2020 Democratic primaries
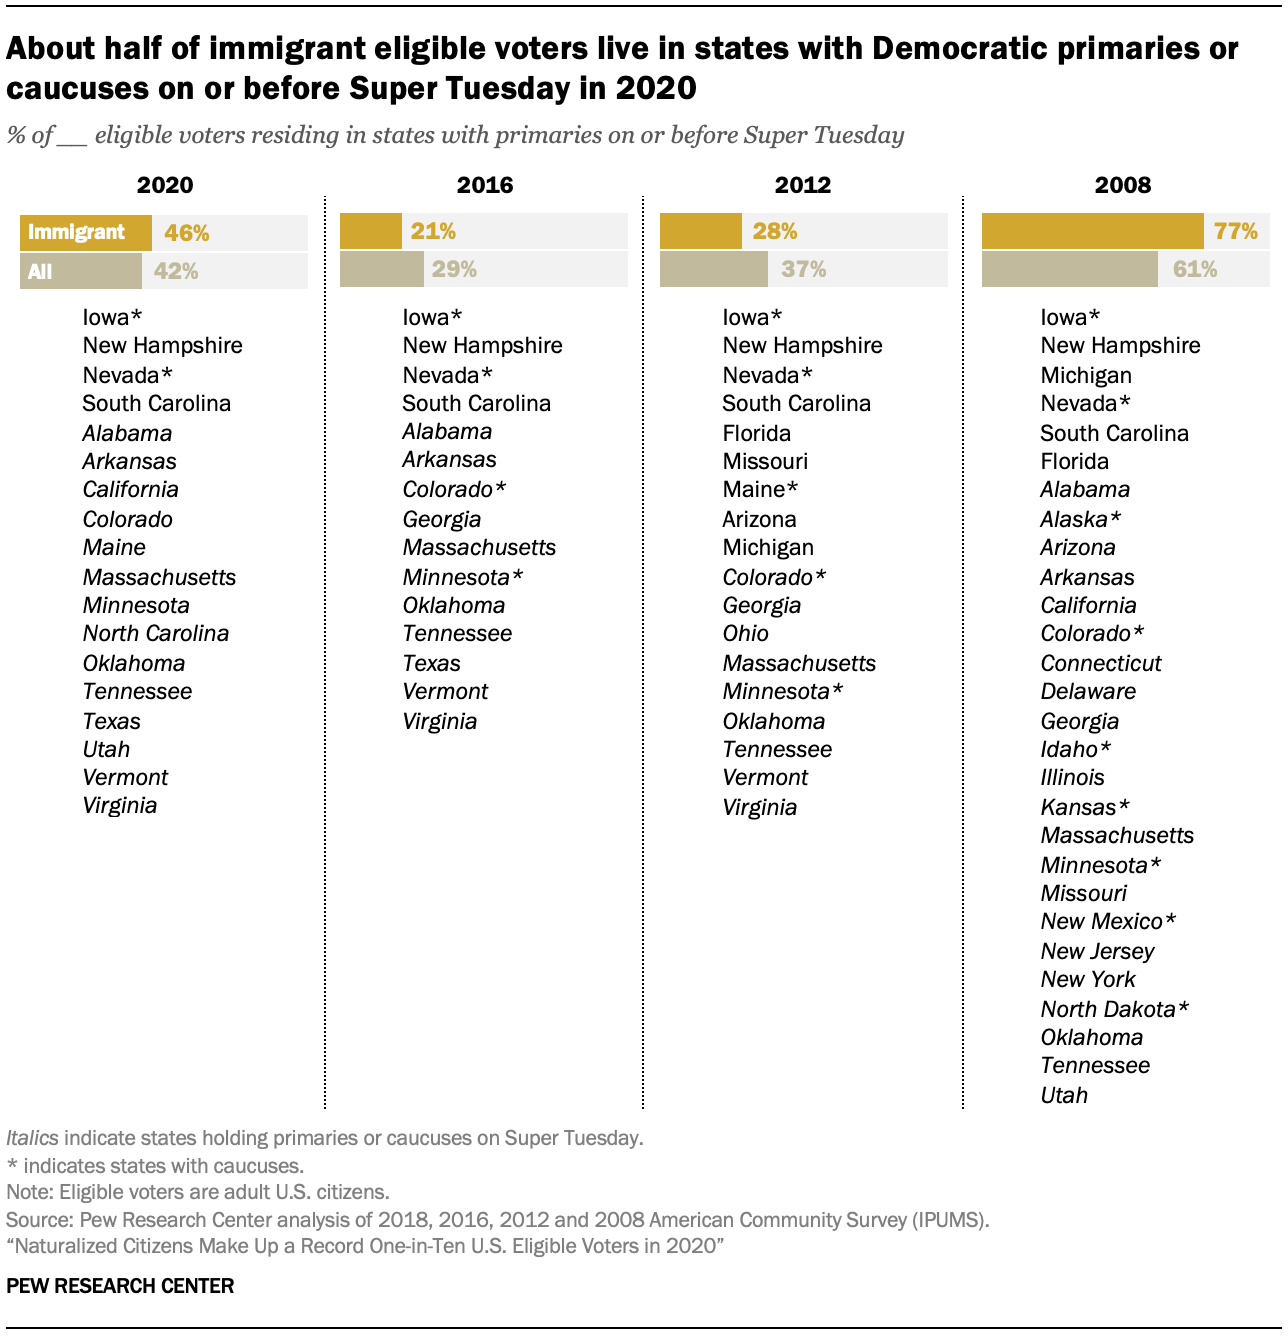
Nearly half (46%) of the nation’s immigrant eligible voters live in states with Democratic primaries or caucuses that take place on or before March 3, Super Tuesday.3 This is up from 21% in 2016, a change driven primarily by movements in the calendar of the Democratic Party’s primaries and caucuses.
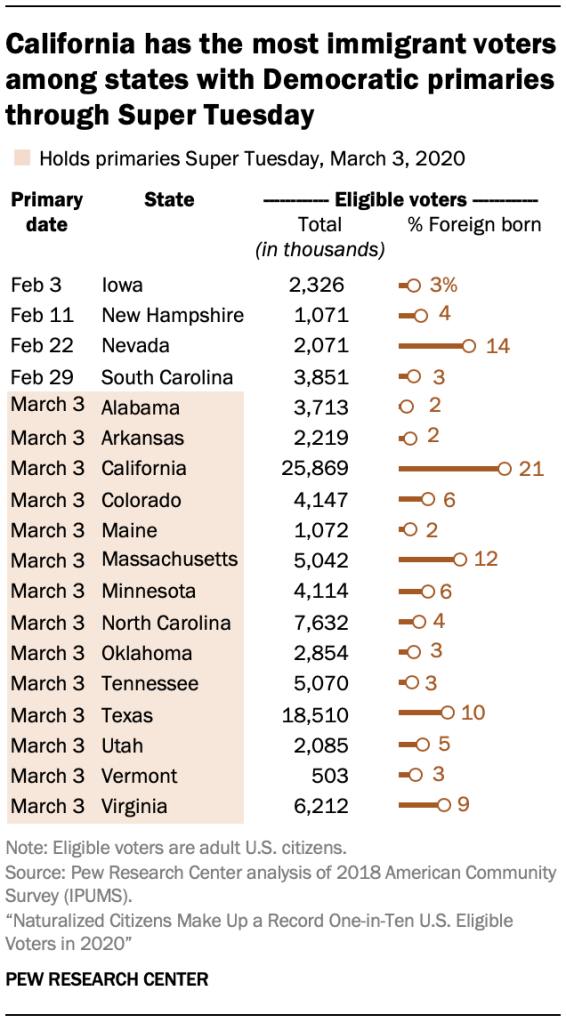
California will hold its Democratic Party primary on March 3, three months earlier than in 2016, bumping up the share of the nation’s immigrant eligible voters that live in Super Tuesday or earlier states. Out of California’s 25.9 million eligible voters, 21% (5.5 million) are foreign born, the highest share of any state through Super Tuesday and in the nation.
Other states with primaries or caucuses on or before Super Tuesday that have large immigrant populations include Texas (1.8 million immigrant eligible voters), Massachusetts (619,000), Virginia (550,000), North Carolina (307,000) and Nevada (293,000). These states, plus California, hold four-in-ten of the nation’s immigrant eligible voters.
While the Democratic primary and caucus calendar through Super Tuesday features many states with large immigrant populations, 2008 included more states with large immigrant populations. Primaries or caucuses on or before 2008’s “Super Duper Tuesday” consisted of states that contained 77% of immigrant eligible voters.