
*Visit the most recent data on U.S. Hispanics.
There were 56.5 million Hispanics in the United States in 2015, accounting for 17.6% of the total U.S. population. In 1980, with a population of 14.8 million, Hispanics made up just 6.5% of the total U.S. population. Read the accompanying blog post, “How the U.S. Hispanic population is changing.”
For a statistical portrait of the foreign-born population in the United States, click here.
Click on the charts below to explore Hispanic population trends.
 |
 |
 |
 |
 |
 |
[chart id=”22141″ class=”noborders”]
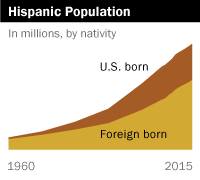
Since 1960, the nation’s Latino population has increased nearly ninefold, from 6.3 million then to 56.5 million by 2015. It is projected to grow to 107 million by 2065, according to the latest Pew Research Center projections. The foreign-born Latino population has increased to nearly 20 times its size over the past half century, from less than 1 million in 1960 to 19.4 million in 2015. On the other hand, while the U.S.-born Latino population has only increased sixfold over this time period, there are about 32 million more U.S.-born Latinos in the U.S. today (37.1 million) than there were in 1960 (5.5 million).
[chart id=”22142″ class=”noborders”]
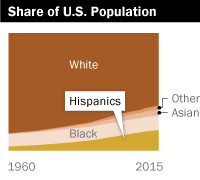
The share of the U.S. population that is Hispanic has been steadily rising over the past half century. In 2015, Hispanics made up 17.6% of the total U.S. population, up from 3.5% in 1960. According to the latest Pew Research Center projections, the Hispanic share of the U.S. population is expected to reach 24% by 2065.
[chart id=”22143″ class=”noborders”]
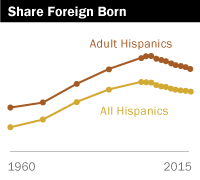
After increasing for at least four decades, the share of the Hispanic population that is foreign born began declining after 2000. Among all Hispanics, the share that was born in another country was 34.4% in 2015, down from a peak of about 40% earlier in the 2000s. The share of adult Hispanics who are foreign born began declining a bit later – 47.9% of Hispanic adults were born in another country in 2015, down from a peak of 55.0% in 2007.
[chart id=”22144″ class=”noborders”]
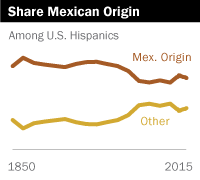
Mexican-origin Hispanics have always been the largest Hispanic-origin group in the U.S. In 1860, for example, among the 155,000 Hispanics living in the U.S., 81.1% were of Mexican origin – a historic high. Since then the origins of the nation’s Hispanic population have diversified as growing numbers of immigrants from other Latin American nations and Puerto Rico settled in the U.S. For example, between 1930 and 1980, Hispanics from places other than Mexico nearly doubled their representation among U.S. Hispanics, from 22.4% to 40.6%. But with the arrival of large numbers of Mexican immigrants in the 1980s and 1990s, the Mexican share among Hispanics grew, rising to a recent peak of 65.7% in 2008, but declining since.
[chart id=”22146″ class=”noborders”]
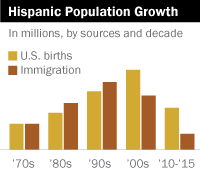
Between 1980 and 2000, immigration was the principal driver of Latino population growth as the Latino immigrant population boomed from 4.2 million to 14.1 million. Since then, however, the primary source of this growth has been U.S. births. Between 2000 and 2010, there were 9.6 million Latino births in the U.S., while the number of newly arrived immigrants was 6.5 million. The present decade is on track to repeat this pattern, with 5 million Latino births in the U.S. between 2010 and 2015, compared with just 1.9 million newly arrived Latino immigrants.
[chart id=”22145″ class=”noborders”]
English proficiency is rising among Hispanics ages 5 and older. In 2015, 69% of Hispanics said they speak only English at home or indicate that they speak English “very well”, up from 59% who said the same in 1980. Most of this growth has been driven by U.S.-born Hispanics, whose English proficiency share has grown from 71.9% in 1980 to 89.7% in 2015. By contrast, English proficiency among foreign-born Hispanics has seen little change over the same period. In 2015, just 34.6% of foreign-born Hispanics reported that they speak only English at home or speak English “very well”, a slight increase from 30.7% in 1980.
