The growth in subprime lending in recent years is considered responsible for both raising homeownership rates among minorities and contributing to the wave of foreclosure since 2005. Loans originating in the subprime market are intended for high-risk borrowers who typically have poor credit histories, low incomes and savings, or other financial limitations. Thus, subprime loans can make homeownership possible for applicants who might not qualify for mainstream loans (Bostic and Lee, 2008; Gramlich, 2007).
However, subprime loans are also susceptible to higher rates of default. Many high-risk or low-income borrowers are eventually unable to maintain payments on loans that carry higher interest rates. Several studies have demonstrated that subprime loans experience higher rates of foreclosure and that the risk of foreclosure remains elevated several years into the term of the loan (Schloemer, Li, Ernst and Keest, 2006).
This section spotlights major trends in mortgage lending in 2006 and 2007, the latest years for which data are available. The analysis is based on data gathered under the provisions of the Home Mortgage Disclosure Act (HMDA). The HMDA data encompass about 80% of lending activity in the U.S. for home purchase and refinancing.22
The HMDA data identify a set of products known as higher-priced loans because they carry an annual percentage rate (APR) above a specific threshold.23 The determination is made by comparing the APR on a loan with the rate on a U.S. Treasury security of comparable maturity. The threshold varies by the type of loan. A first-lien loan is considered higher priced if the interest on it exceeds the rate on the comparable Treasury security by 3 percentage points or more. The threshold for a second-lien loan is 5 percentage points.
Higher-priced loans are used in this section as a stand-in for subprime loans. The two are not identical. However, most higher-priced loans are believed to originate in the subprime market and subprime loans are often higher priced. Thus, higher-priced loans are frequently used as a proxy for subprime activity (Bocian, Ernst and Li, 2006; Mayer and Pence, 2008).
The focus of this section is on home purchase loans only; refinance loans are excluded. Moreover, the analysis is confined to first-lien conventional home purchase loans for one- to four-family homes intended for owner occupancy.24 Examples of specific types of loans not included in the analysis are loans for purchase of manufactured homes and loans for home improvement. Thus, the data presented in this section are not meant to represent the universe of home mortgage loans.
Loans for Home Purchase
Changes from 2006 to 2007
As home sales plunged, so did lending for home purchases. The number of loan applications and, consequently, the number of loan originations in 2007 were well below their 2006 levels.25
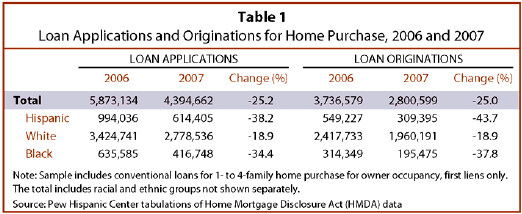
The decline in loan applications and originations was greater among minorities than among whites.26 Applications from Hispanics fell 38.2% from 2006 to 2007, and applications from blacks decreased 34.4%. This most likely reflects the fact that the drop in lending in 2007 was more severe in the subprime market and that Hispanics and blacks are disproportionately served in that market compared with their share of applicants (see Table 5 and Figure 14 below).
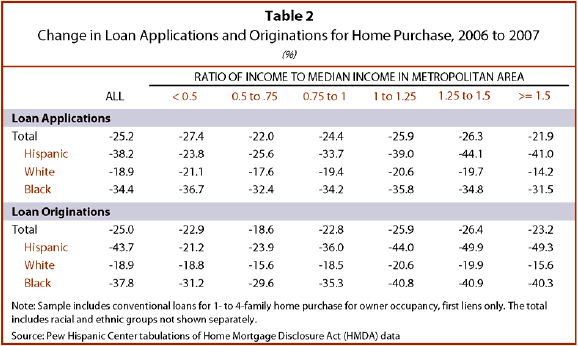
A striking aspect of the changes in 2007 is that, among minorities, lending activity dropped most for high-income homebuyers (Table 2). Among Hispanics, loans originated to the highest income homebuyers decreased at a faster rate (49.3%) from 2006 to 2007 than did loans to the lowest income buyers (21.2%).27 Unfortunately, the HMDA data do not contain enough detail on loan and borrower characteristics to determine the reasons behind this trend.
Loans Originated and Their Size, by Race and Ethnicity, 2007
Applications by Hispanics and blacks are less likely to result in loan originations than are applications by white householders. But when they do take out loans, Hispanics and blacks tend to borrow larger amounts than whites for a variety of reasons. That, coupled with lower median income levels,28 translates into higher loan-to-income ratios for minority borrowers.
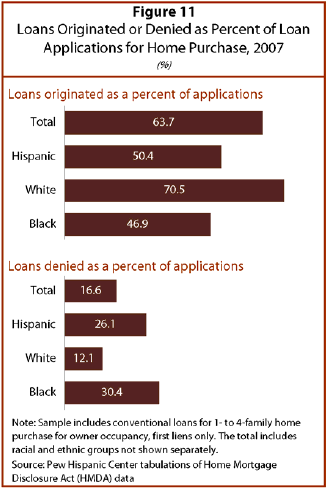
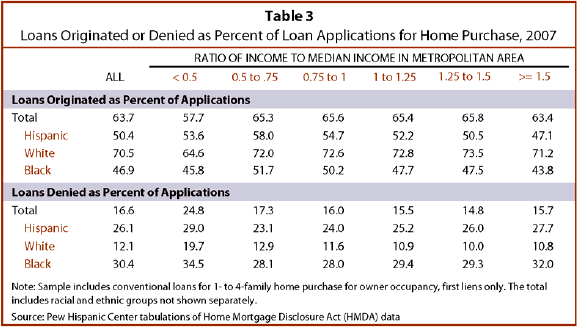
In 2007, half (50.4%) of applications for home purchase from Hispanic householders resulted in loan originations (Figure 11).29 That was slightly greater than the origination rate for blacks (46.9%) but much less than the rate for whites (70.5%). Conversely, denial rates were higher for Hispanics (26.1%) and blacks (30.4%) than for whites (12.1%).30
The income of Hispanic and black applicants does not seem to affect the likelihood of denial. In 2007, the denial rate for Hispanics in the highest income groups was 27.7%, about the same as the rate for Hispanics in the lowest income group (29.0%). Similarly, black applicants, regardless of income, faced a denial rate of about 30% (Table 3). Meanwhile, the denial rate for high-income whites (10.8%) was only about half as much as the rate for low-income whites (19.7%). Thus, based on denial rates, the disparity in lending between minority and white households in 2007 increased with income.
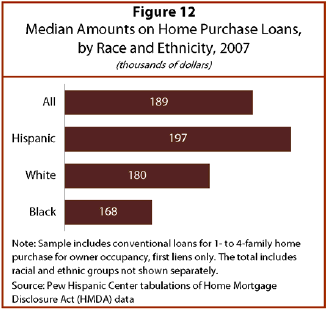
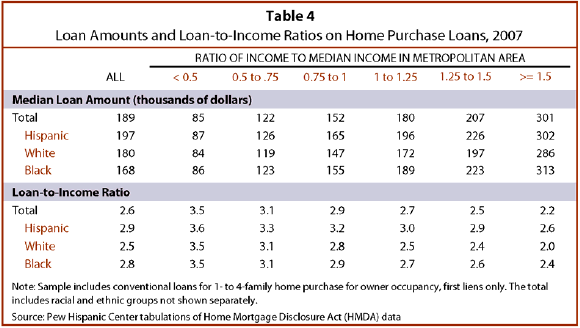
Notwithstanding higher denial rates, home loans made to Hispanics in 2007 were for larger amounts than loans made to whites. The median loan to Hispanics was $197,000 compared with $180,000 to whites and $168,000 to blacks (Figure 12). Within most income categories, however, there is little difference in the amounts loaned to Hispanics and blacks. Both minority groups in each income category received larger loans than did whites in that category (Table 4).31
Geography helps to explain why Hispanic homebuyers borrow more on average than whites do. California, Texas, Florida, Arizona, Illinois, New York and New Jersey accounted for 70.7% of loans that originated to Hispanics in 2007, compared with 32.9% for whites. With the exception of Texas and Arizona, these states either are uniformly higher priced (such as California) or have higher-priced pockets (such as Chicago).32 Thus, the greater concentration of Latinos in higher-priced areas makes it more likely that they will borrow greater sums.
Another likely explanation is that minority households have fewer resources of their own to commit to a home purchase.33 That is also one of the reasons Latino and black households are more likely to seek loans in the subprime market that require low down payment.
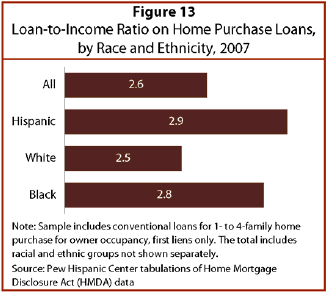
The result is that Hispanics and blacks who want to buy homes face greater financial exposure than whites (Figure 13). The 2007 loan-to-income ratio among Hispanics (2.9) and blacks (2.8) was higher than among whites (2.5). This was true even within individual income groups (Table 4). In fact, the loan-to-income ratio of high-income Latinos (2.6) was 30.0% higher than that of high-income whites (2.0).
Higher-Priced Loans
Changes from 2006 to 2007
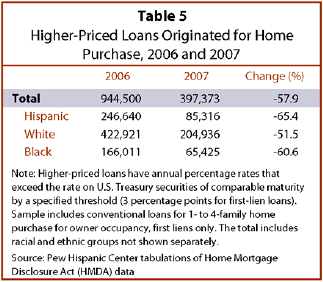
Lending in the subprime market dropped at a faster rate from 2006 to 2007 than did lending in the market overall. As shown in Table 5, the number of higher-priced loans that originated in 2007 was less than half the number that originated the year before—397,373 loans in 2007, compared with 944,500 in 2006, a decrease of 57.9%. The greatest drop was among Hispanics (65.4%); the drop was 60.6% for blacks and 51.5% for whites.
As a result, the share of higher-priced loans in overall lending also fell sharply—from 25.3% in 2006 to 14.2% in 2007 (Figure 14). A potential benefit of this development is that it probably will reduce the future risk of default in the mortgage market.
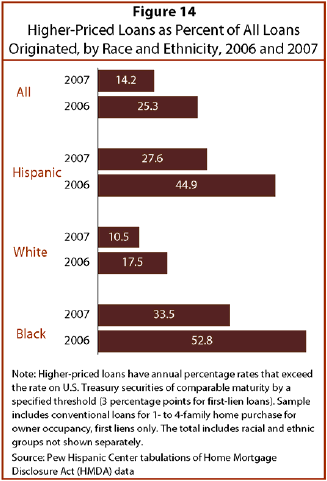
The declining share of higher-priced lending is evident for all racial and ethnic groups. In 2007, 27.6% of all loans originated to Hispanics were higher priced, as were 33.5% of loans to blacks and 10.5% of loans to whites. For each group the share of higher-priced lending was greater in 2006—44.9% for Hispanics, 52.8% for blacks and 17.5% for whites.
However, minority households remain far more likely to receive a higher-priced loan than are white households. In 2007, Hispanics were about 2.5 times as likely to receive a higher-priced loan as whites, and blacks were about three times as likely. That disparity is no different from 2006.34
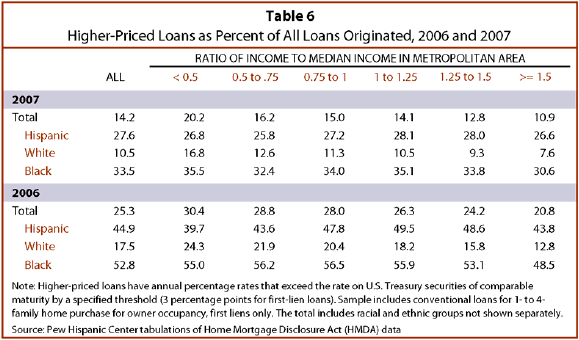
The subprime market also does not seem to distinguish among high- and low-income minority borrowers. High-income Hispanics and blacks are about as likely to receive a higher-priced loan as are low-income Hispanics and blacks. For example, in 2007, 26.8% of loans to low-income Latinos and 26.6% of loans to high-income Latinos were higher priced (Table 6). In contrast, the share of higher-priced loan originations to whites drops rapidly with income, from 16.8% for low-income whites to 7.6% for high-income whites. Consequently, high-income Latinos and blacks are at a greater disadvantage relative to whites than are low-income Latinos and blacks.
The Cost of Higher-Priced Loans
By definition, higher-priced loans carry an annual percentage rate that is at least 3 percentage points higher than the rate on a U.S. Treasury security of comparable maturity. The median rate spread among all higher-priced loans in 2007 was 4 percentage points (Table 7). Judging by this yardstick, the cost of higher-priced loans to Latinos and whites in 2007 were similar—a rate spread of 4.1 percentage points for Latinos compared with 3.9 percentage points for whites. This similarity extends through all income groups.

The cost to blacks with higher-priced loans was greater than the cost to Latinos and whites. The median rate spread for blacks was 4.7 percentage points in 2007, nearly a percentage point higher than the cost to whites. The disparity is present within each income group.
However, the difference between the rate on higher-priced loans and the rate on a U.S. Treasury security is not the same as the difference between the rate on higher-priced loans and the rate on conventional mortgage loans. In 2007, the annual yield on a 30-year Treasury security averaged 4.8%. Based on the typical rate spread for black borrowers (4.7%), the annual cost of a 30-year higher-priced loan would have been about 9.5%. At the same time, the average rate on a 30-year fixed-rate conventional mortgage was 6.3%. That means that for blacks who had a higher-priced mortgage, the typical rate was about 3 percentage points greater than the rate on a typical 30-year fixed-rate conventional mortgage. Similarly, for Latinos who had a higher-priced mortgage, the typical rate was estimated to be 2.5 percentage points higher than the conventional 30-year fixed-rate mortgage in 2007.35
Lending Relative to Borrowers’ Incomes for Higher-Priced Loans
Taken relative to the incomes of borrowers, loan amounts disbursed in the high-cost segment of the mortgage market are smaller than average. Table 8 shows the loan-to-income ratio for higher-priced loans. The ratios for higher-priced loans are almost universally smaller than the ratios for all loans (see Table 4).
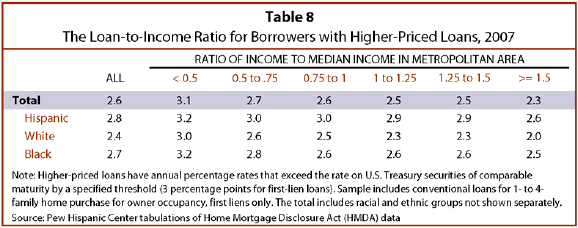
The phenomenon is most pronounced among borrowers with income less than the median income in their metropolitan area of residence, regardless of their race and ethnicity. For example, among the lowest income Hispanics in 2007, the loan-to-income ratio for higher-priced loans was 3.2 (Table 8), compared with 3.6 for all loans (Table 4). Among low-income whites, the loan-to-income ratio for higher-priced loans was 3.0 (Table 8), compared with a ratio of 3.5 for all loans (Table 4).36


