The 10 million increase in the Hispanic population nationwide since 2000 has been accompanied by an increase of 9.8 million non-Hispanics.7 The growth among Hispanics has been more widespread but also more concentrated in comparison to non-Hispanic growth.

Most counties experienced an increase in their Hispanic population in the new century. The Hispanic population increased in 1,295 of the 1,362 counties that had at least 1,000 Latinos in 2007. Not all counties experienced growing Latino populations, and Table 10 reports the counties with the largest Hispanic population declines.
Compared to the widespread Hispanic growth, fewer counties experienced an increase in their non-Hispanic population. In about one-third of counties (474 counties), the non-Hispanic population decreased from 2000 to 2007, so only 888 counties had increases in non-Hispanic population.
Though more counties have experienced Hispanic growth than non-Hispanic growth, Hispanic growth has been concentrated in fewer counties. Just 38 counties account for half of the nation’s Hispanic population increase. Non-Hispanics are less concentrated geographically, and their growth is less concentrated. Half of the nation’s non-Hispanic population increase occurred in 54 counties. This more widespread but concentrated growth continues the pattern that demographers observed in the 1990s (Kandel and Cromartie, 2004).
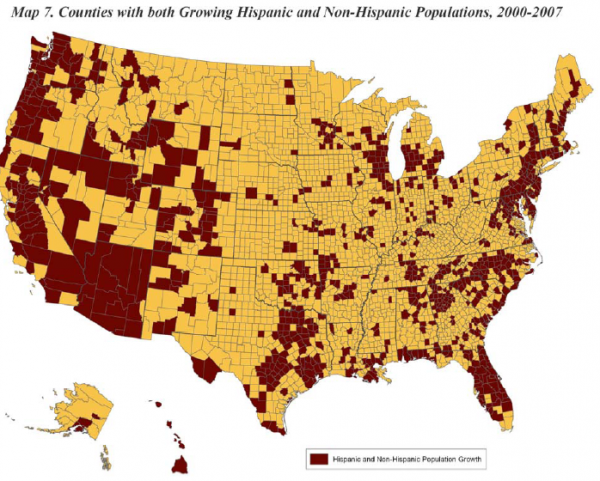
Most of the counties that experienced Hispanic population growth had an increase in their non-Hispanic population as well (Map 7). Some 867 counties had growing non-Hispanic populations as well as Hispanic populations. About two-thirds of these counties are metropolitan counties.
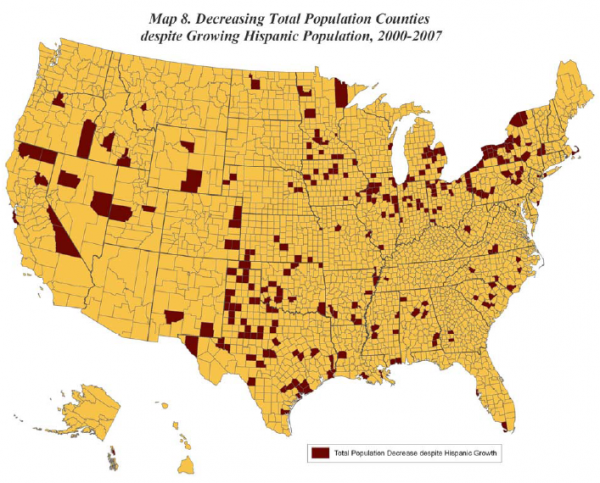
In about one-of-five counties, the total population declined despite an increase in Hispanic population (Map 8). About two-thirds of these 264 counties are non-metropolitan counties. Cook County, Illinois, the nation’s second most populous county (5.3 million residents) and the county that includes Chicago, lost population since 2000 despite a growing Hispanic population.
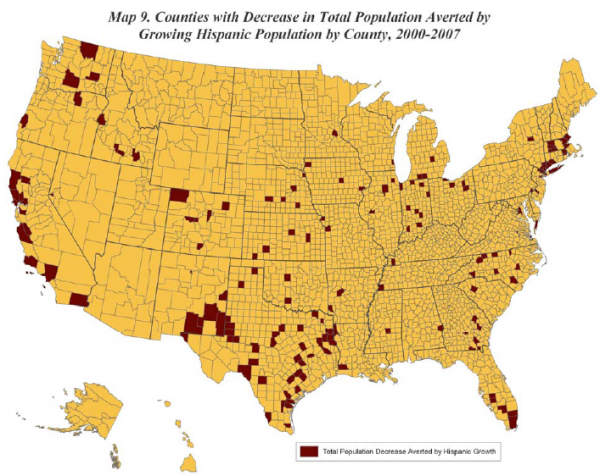
Finally, in 164 counties the total population would have declined since 2000 if the Hispanic population had not increased—in other words, the Hispanic population increase was greater in absolute value than the non-Hispanic population decline (Map 9). Counties in which Hispanic population gains averted total population decreases include some of the largest in the nation: Los Angeles; Miami-Dade; Dallas; Queens, Suffolk, Bronx and Westchester in the New York metropolitan area; Milwaukee; and DuPage in suburban Chicago.
Total Population Growth in the Fast-Growing Hispanic Counties
The 676 fast-growing Hispanic counties in the new century are largely metropolitan counties, and they tend to be counties with growing non-Latino populations as well. “More than ever, the new destinations for Hispanic populations overlap with growth centers for overall U.S. population” (Frey, 2006). In 567 of the 676 counties, the non-Hispanic population also increased since 2000. As Table 11 shows, the Hispanic population increased by 5.1 million in these counties in the new century. The Hispanic growth was accompanied by an increase of 9.9 million non-Latinos. Non-Hispanics as well as Hispanics are increasing in the nation’s fast-growing Hispanic counties.
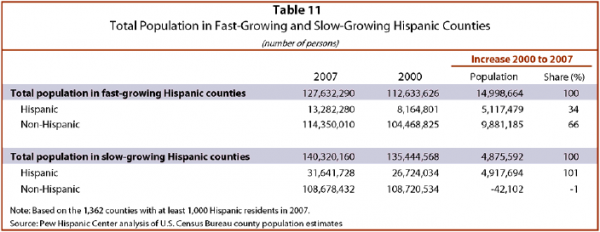
By contrast, in the nation’s 686 slow-growing Hispanic counties, Hispanic growth has not been matched by accompanying non-Latino growth. In only 321 of these counties has the non-Hispanic population increased since 2000. Furthermore, in the aggregate, Hispanic population growth in these counties accounts for the entire population increase in these areas. Hispanic growth of 4.9 million Latinos in these counties was accompanied by a small decline in the non-Hispanic population.


