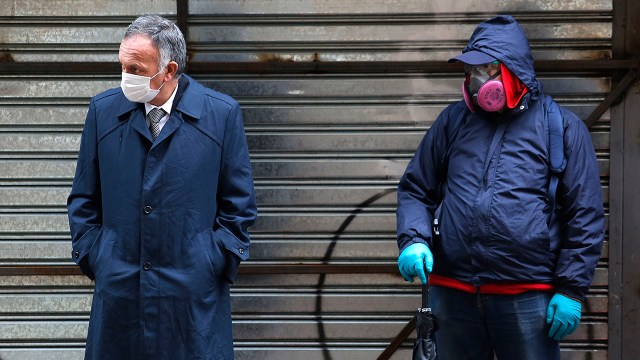
The COVID-19 pandemic has created an economic crisis, shuttering businesses and cutting jobs around the world. This report looks at how the downturn has affected the standard of living globally and in seven major regions.
The focus is on the distribution of people across five income tiers in 2020: poor, low income, middle income, upper-middle income and high income. See the methodology and an earlier Pew Research Center report for more on the definition and meaning of these tiers in a global context.
The key data source for the analysis is the World Bank’s PovcalNet database, which provides access to household survey data on either income or consumption for more than 160 countries. At the regional level, the latest year for which comprehensive data are available ranges from 2014 for South Asia to 2018 for East Asia and the Pacific and three other regions. The global regions are as defined by the World Bank.
These benchmark estimates of income are extrapolated to 2020 using World Bank estimates of output growth through 2020. One projection is based on the World Bank’s January 2020 forecasts of economic growth in 2020, and the other is based on its January 2021 estimates of growth in 2020. The difference between these two measures is used to represent the effect of the pandemic on the income distribution in each region. Regional estimates are summed to yield estimates of the global distribution.
The COVID-19 pandemic is having a deep effect on the global economy. In January 2020, as reports of the novel coronavirus were emerging, the World Bank forecasted that the global economy would expand by 2.5% that year. In January 2021, with the pandemic still holding much of the world in its grip, the World Bank estimated that the global economy contracted by 4.3% in 2020, a turnabout of 6.8 percentage points.
The economic downturn is likely to have diminished living standards around the world, pushing millions out of the global middle class and swelling the ranks of the poor. At the same time, the path to a recovery is clouded with uncertainties.
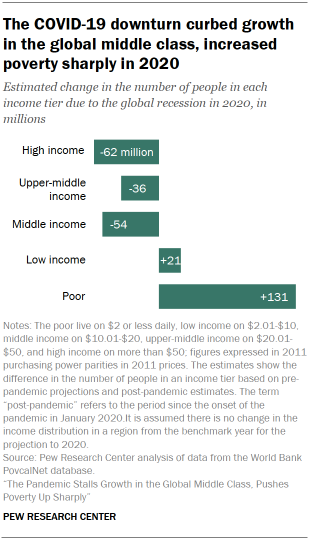
A new Pew Research Center analysis finds that the global middle class encompassed 54 million fewer people in 2020 than the number projected prior to the onset of the pandemic. Meanwhile, the number of poor is estimated to have been 131 million higher because of the recession.
The drop-off in the global middle class was centered in South Asia and in East Asia and the Pacific, and it stalled the expansion seen in the years preceding the pandemic. South Asia, specifically India, along with Sub-Saharan Africa, accounted for most of the increase in poverty, reversing years of progress on this front.
As defined in this report (and in previous Pew Research Center analyses), people who are middle income live on $10.01-$20 a day, which translates to an annual income of about $14,600 to $29,200 for a family of four. This is modest by the standards of advanced economies. In fact, it straddles the official poverty line in the United States – about $23,000 for a family of four in 2020 (expressed in 2011 prices). By global standards, the poor live on $2 or less a day, or no more than $2,920 annually for a family of four.
The number of people in the global high-income tier (more than $50 daily) is estimated to have decreased by 62 million in 2020, erasing about half of the gain since 2011, with most of the change emanating from advanced economies. Meanwhile, the upper-middle income population ($20.01-$50 daily) fell by 36 million, while the low-income population ($2.01-$10 daily) is estimated to have increased by 21 million.
Who is middle class (or middle income)?
This report uses the terms “middle income” and “middle class” interchangeably, a common practice among economists who tend to define the middle class in terms of income or consumption. But being middle class can connote more than income, be it a college education, white-collar work, economic security, owning a home, or having certain social and political values. Class could also simply be a matter of self-identification. The interplay among these many factors is examined in studies by Hout (2007) and Savage et al. (2013), among others.
The population in each global region is divided into five groups: poor, low income, middle income, upper-middle income and high income. The poor live on $2 or less daily, low income on $2.01-$10, middle income on $10.01-$20, upper-middle income on $20.01-$50 and high income on more than $50. All dollar figures are expressed in 2011 prices and purchasing power parity dollars, currency exchange rates adjusted for differences in the prices of goods and services across countries.
The assignment to a group, or income tier, is based on a household’s daily per capita income or consumption, a simple way of controlling for differences in household size. In the source data, some countries only report income data while others only report consumption data. The terms “income” and “consumption” are used interchangeably for the sake of convenience.
A middle-income, or middle-class, threshold of $10 follows the practice of other researchers. A similar threshold has been used by the World Bank (2007, 2015), researchers at the Organization for Economic Cooperation and Development (Kharas, 2010), the development community (Birdsall, Lustig and Meyer, 2013) and others. There is evidence that the $10 threshold, which is about five times higher than the World Bank’s global poverty line, is associated with economic security and “insulates” people from falling back into poverty. An earlier Pew Research Center report discusses the choice of income thresholds in greater detail.
The global middle-class standard is modest by the standards of advanced economies. In 2020, the official poverty line for a family of four in the U.S. stood at about $15.90 per person per day (in 2011 prices). Thus, many who are poor by the U.S. definition would meet the global middle-income standard or, conversely, many who are in the global middle class would be poor by U.S. standards.
These estimates are based on the Center’s analysis of World Bank data on the distribution of people by either income or consumption levels in seven major global regions. The latest available estimates of income for each region, such as for 2018 for Europe and Central Asia and 2015 for the Middle East and North Africa, are extrapolated to 2020 using two sets of growth estimates: the forecasts issued by the World Bank in January 2020, prior to the pandemic, and the estimates issued in January 2021, with the pandemic’s economic impact in plainer sight. The difference between these two measures is taken to represent the impact of the COVID-19 downturn on the standard of living of people globally.
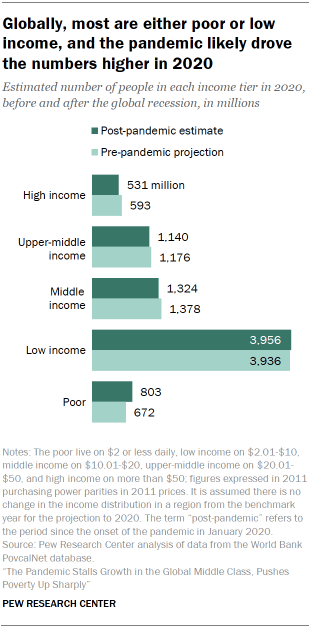
Prior to the emergence of COVID-19, some 1.38 billion people were expected to be counted in the global middle class in 2020. But the pandemic is estimated to have driven this number down to 1.32 billion. The share of people in the middle class globally is estimated to have been 17.1% in 2020, instead of potentially 17.8%. The erosion in the middle class might have been deeper if not for the fact that China – which is home to more than one-third of the global middle class – evaded an economic contraction, even though growth there was slower than anticipated.
The number of global poor is estimated to have risen to 803 million in 2020, much greater than the 672 million initially expected. The global poverty rate, which had been in steady decline this century, is likely to have increased to 10.4%, nearly reverting to the rate in 2017, instead of sinking to a new low of 8.7%, as previously expected.
The steep rise in global poverty is driven by the fact that many who were in the low-income tier prior to the pandemic lived on the margin of poverty. In 2017, 877 million people lived on $2 to $3 a day, according to World Bank estimates. Thus, large numbers were susceptible to falling back into poverty prior to the pandemic, especially in South Asia and Sub-Saharan Africa.
At the other end of the economic spectrum, the global high-income population likely fell to 531 million in 2020 from the 593 million originally expected. Consequently, the expected share in the high-income tier is 6.8%, not 7.6%. A vast majority of the global high-income population lives in advanced economies, and this group of countries also experienced a sharp downturn in 2020. Ironically, this bolstered the global middle-income population as people in advanced economies slipped down the ladder from higher income tiers.
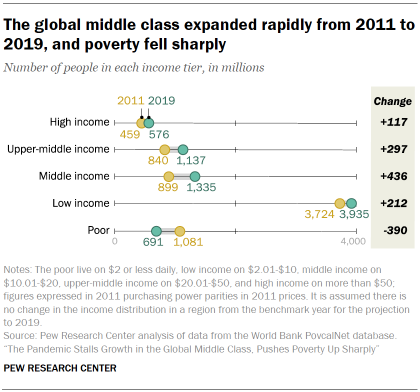
The reversal in global living standards in 2020 comes on the heels of notable progress earlier in the decade. From 2011 to 2019, the global middle-class population increased from 899 million to 1.34 billion, or by 54 million people annually, on average. The pandemic is estimated to have erased a year of growth, leaving the global middle-class population nearly unchanged from 2019 to 2020.
Global poverty had abated at an average rate of 49 million annually from 2011 to 2019, with the number of global poor falling from 1.10 billion to 691 million during this period. The pandemic, by adding 131 million to the ranks of the poor, has set the progress on poverty back by several years, and the poverty rate is estimated to have increased from 9.0% in 2019 to 10.4% in 2020.
From 2011 to 2019, the global high-income population had increased from 459 million to 576 million, growing by an average of 15 million annually. Thus, the setback of 62 million due to the pandemic in 2020 also reverses several years of growth in the high-income population. The share of the global population in the high-income tier is expected to have decreased from 7.5% in 2019 to 6.8% in 2020.
The erosion of the middle class is centered in Asia, the rise in poverty in Asia and Africa
The effect of the COVID-19 downturn on the middle class and other income tiers shows distinct regional differences. Asia is expected to have accounted for most of the shrinking of the global middle class in 2020, with the middle-class population falling by 32 million in South Asia and by 19 million in East Asia and the Pacific. Meanwhile, the middle class in advanced economies is estimated to have increased by 16 million, in part due to the drop-off in the high-income tier in those countries.
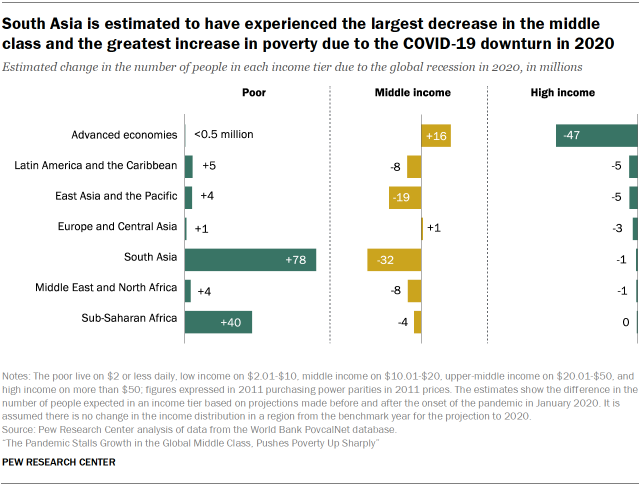
The projected rise in global poverty in the pandemic is concentrated in South Asia (an increase of 78 million) and Sub-Saharan Africa (40 million), historically among the poorest regions in the world. The high-income population in advanced economies is estimated to have shrunk by 47 million in 2020, accounting for most of the falloff globally. It should be noted that the global cutoff for the high-income tier – more than $50 a day – is not much higher than the median income across advanced economies, as an estimated 40% of the population in these countries is in the global high-income tier. Thus, the contraction of the high-income tier in advanced economies is more a reflection of the reduction in the standard of living of the typical person in these countries than outcomes for the wealthy.
The contribution of a region to global changes overall and the shift in its own income distribution depends mostly on two factors: the sizes of income tiers in the region prior to the COVID-19 recession and the impact of the downturn on economic growth in the region.
Prior to the pandemic, nearly half of the global middle-class population – 672 million of 1.38 billion – was estimated to live in East Asia and the Pacific, a region that includes China. Latin America and the Caribbean accounted for 191 million, and Europe and Central Asia was home to 183 million. South Asia accounted for 123 million more.
In view of these magnitudes, the estimated loss (relative to pre-pandemic expectations) of 32 million people from the middle class in South Asia is notable for two reasons. First, the region contributed the most to the shrinking of the global middle class in 2020 despite having a middle-income population smaller than several other regions. Second, the percentage decrease in South Asia’s middle-income population from what was previously expected (26%) is much greater than in any other region. Although East Asia and the Pacific shed 19 million from the middle-income tier, that represented only 3% of its middle class.
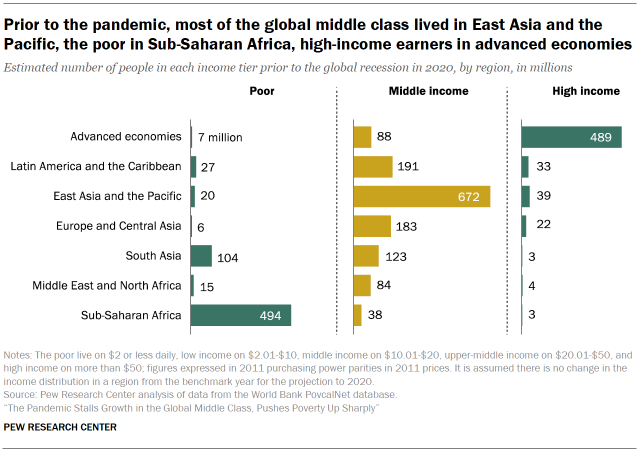
Poverty is most prevalent in Sub-Saharan Africa. Some 494 million people in Sub-Saharan Africa, out of a total population of 1.14 billion, were expected to be living in poverty ahead of the pandemic in 2020. South Asia, with a total population of 1.86 billion, was expected to be home to 104 million poor. Nonetheless, South Asia is estimated to have added nearly double the amount of people to the ranks of the globally poor as Sub-Saharan Africa in the pandemic. The percentage increase in poverty in South Asia (75%) dwarfs the increase in Sub-Saharan Africa (8%).
The number of poor in other regions was smaller, estimated to range from 6 million in Europe and Central Asia to 27 million in Latin America and the Caribbean ahead of the pandemic in 2020. But, since that moment, the increase in poverty in these regions is notable. The Middle East and North Africa and East Asia and the Pacific are each estimated to have seen increases in poverty of more than 20% due to the recession. The rise in poverty in both Europe and Central Asia and Latin America and the Caribbean is not far behind, with each experiencing a 17% increase in poverty.
A large majority of the global high-income population – 489 million of 593 million – lived in advanced economies before the global recession took hold. The estimated decrease of 47 million, or 10%, in this population in advanced economies accounts for most of the shrinking of the global high-income tier.
In proportional terms, the drop off in the high-income tier is also notable in Latin America and the Caribbean (15%), Europe and Central Asia (12%) and East Asia and the Pacific (12%). The losses in the Middle East and North Africa, South Asia and Sub-Saharan Africa are relatively small in magnitude (each less than 1 million people) but also represent double-digit shares of the high-income populations in those regions.
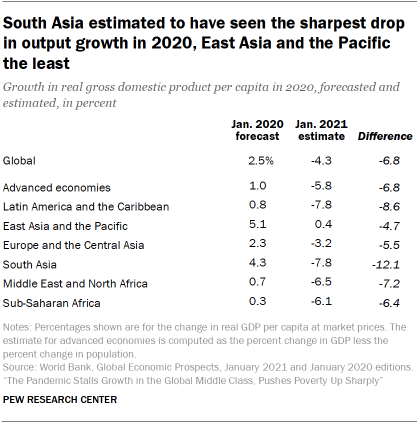
The relatively outsized role of South Asia in the contraction of the global middle class and the expansion of poverty is the result of it seeing the sharpest reduction in economic growth in the pandemic. In January 2020, the World Bank forecasted that South Asia would experience a 4.3% increase in gross domestic product (GDP) per capita in 2020. But, in January 2021, output in South Asia was estimated to have decreased by 7.8% in 2020, a retreat of 12.1 percentage points from potential.
The setback to economic growth in other regions is smaller, ranging from 4.7 percentage points in East Asia and the Pacific to 8.6 points in Latin America and the Caribbean. East Asia and the Pacific is the only region in which growth is estimated to have stayed positive in 2020, with GDP per capita inching up by 0.4% even after the onset of the pandemic. Otherwise, the latest estimates of the change in output per capita in 2020 ranged from -3.2% in Europe and Central Asia to -7.8% in Latin America and the Caribbean.