

Uncertainty driven by the current coronavirus outbreak has caused the U.S. stock market to wipe away three years of gains in a matter of weeks. The S&P 500 index fell from 3,386 on Feb. 19 this year to 2,305 on March 20, a loss of 32%. This rate of descent is much sharper than during the initial stages of the Great Recession, when it took from October 2007 to October 2008 to see a similar decrease in the index.
The economic stimulus package agreed to by Senate leaders and the White House appears to have restored some optimism in the market, at least for now. Even so, the losses will impact a wide swath of American families.
The steep fall in stock prices comes at a time when roughly four-in-ten U.S. workers (41%) have access to employer- or union-sponsored retirement plans, with the values of many of these plans linked to the stock market.
How we did this
The economic uncertainty and upheaval caused by COVID-19 has contributed to a broad-based decline in the value of U.S. stock exchanges. This post explores how many families have a financial stake in equity markets.
Most of the analysis is based on the 2016 Survey of Consumer Finances (SCF), sponsored by the Federal Reserve Board of Governors and the Department of the Treasury. This is a triennial survey, and 2016 is the most recent one available. The SCF is designed to provide detailed information on the assets and liabilities of U.S. households. It also has detailed demographic information on the head of each family (a family is often the same as a household, consisting of an individual, couples and other family members, where present). In this post, the terms “family” and “household” are used interchangeably.
Workers’ access to a union- or employer-sponsored pension or other retirement plan is based on the 2019 Current Population Survey Annual Social and Economic Supplement (IPUMS). Historical data on S&P 500 index closings was derived from Yahoo Finance. All dollar values are in 2016 dollars.
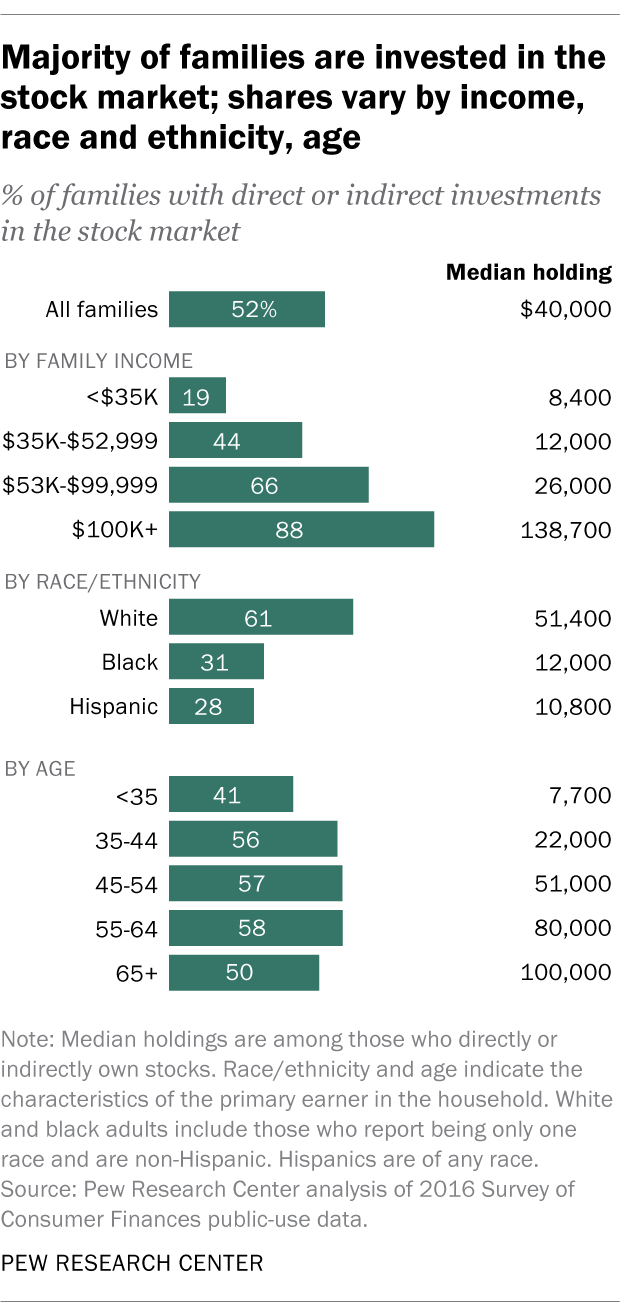
Participation in the stock market varies considerably across demographic groups. But even among those with annual family incomes of less than $35,000, about one-in-five have assets in the stock market. The shares increase as income rises, and among those with incomes above $100,000, 88% own stocks – either directly or indirectly. The amount of assets families hold in stocks also varies considerably by income. Among those with incomes less than $35,000, the median amount held is less than $10,000. For those at the higher end of the income scale, the median amount is more than $130,000.
Families headed by white adults are more likely than those headed by black or Hispanic adults to be invested in the stock market. A majority (61%) of non-Hispanic white households own some stock, compared with 31% of non-Hispanic black and 28% of Hispanic households. Median investments vary here as well: Among whites the median is about $51,000. By comparison, the median for black families is $12,000, and for Hispanic families it is just under $11,000.
There are differences by age as well, but even among families headed by a young adult (those under 35), 41% own some stock, either directly or indirectly. This is true of a majority of households headed by those ages 35 to 64 and half of those ages 65 and older. Assets accumulated over time also vary by age. The median amount invested by young adult households is relatively small – $7,700 among those younger than 35. And it rises steadily with age: $22,000 for households headed by 35- to 44-year-olds, $51,000 for those ages 45 to 54 and $80,000 or higher for those 55 and older.
Stocks represent a larger share of the total value of assets for some groups than others. For higher-income families (those with incomes over $100,000), whites and those ages 55 and older, investments in the stock market make up about a quarter of their total assets. For those with incomes less than $53,000, black- and Hispanic-led households and those headed by someone younger than 35, stocks represent only about 10% of their total assets.
The future direction of stock market prices is unknown. During the financial crisis that triggered the Great Recession, the S&P 500 index lost 53% of its value from October 2007 to February 2009. The recovery took longer, and it was not until March 2013 that the index returned to its pre-recession peak. From March 2013 to February 2020 the index value increased by 88%. But the losses so far in the stock market prompted by COVID-19 have turned the clock back to early 2017.

