
Around this time each year, hundreds of thousands of hopeful would-be college students find out which of the (sometimes many) schools they’ve applied to have accepted them. The ultralow admission rates at many “elite” colleges are getting more attention than usual this year in the wake of a college admissions scandal that has ensnared dozens of well-to-do parents, accused of using bribes to get their children into desirable schools.
But for all the attention paid to those brand-name institutions, the full picture of college admissions is quite different: The great majority of schools, where most Americans get their postsecondary education, admit most of the people who apply to them, according to a new Pew Research Center analysis of U.S. Education Department data.
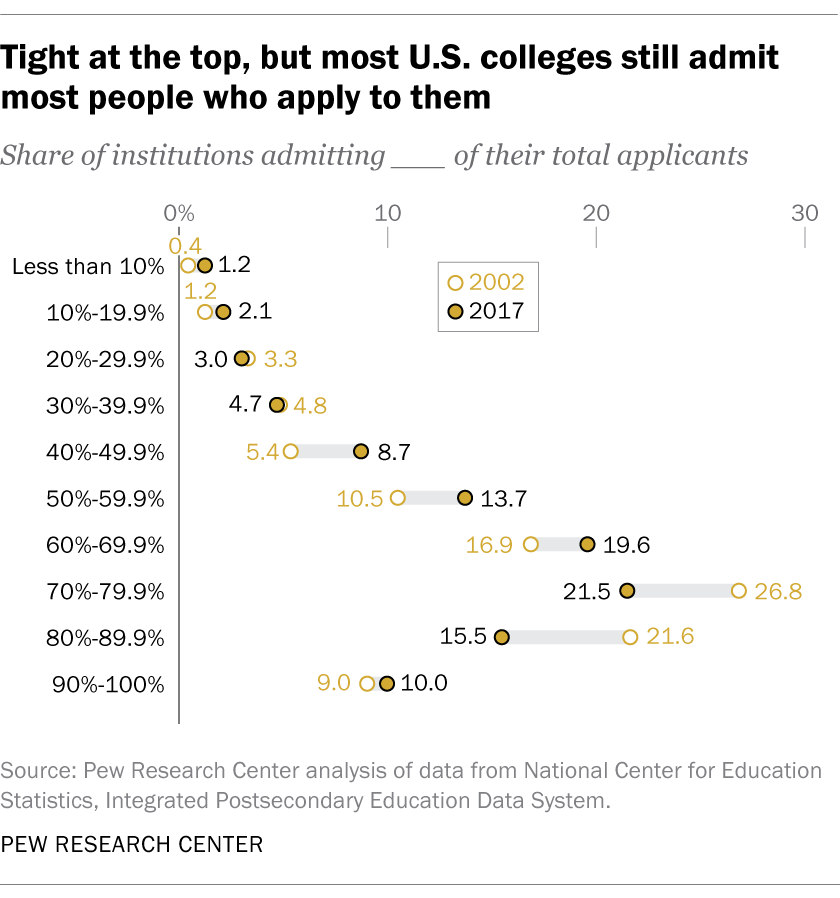
Of the 1,364 four-year colleges and universities we looked at, 17 admitted fewer than 10% of applicants in 2017, the most recent year for which comprehensive data are available. That group includes such prestigious names as Stanford (4.7%), Harvard (5.2%), Yale (6.9%) and Northwestern (9.2%). Another 29 schools admitted between 10% and 20% of applicants, including Georgetown (15.7%), the University of Southern California (16%), UCLA (16.1%) and the University of California, Berkeley (17.1%). All those schools, along with three others with higher admission rates, have been caught up in the admissions scandal – either because coaches and other athletic personnel were indicted on charges of taking bribes to designate unqualified students as “recruited athletes,” or because parents of current students are accused of paying for other kinds of cheating (including on admissions tests) to get their children admitted.
The extremely competitive schools amounted to 3.4% of all the colleges and universities in this analysis, and they accounted for just 4.1% of total student enrollment. By contrast, more than half of the schools in our sample (53.3%) admitted two-thirds or more of their applicants in 2017, including such well-known names as St. John’s University in New York (67.7%), Virginia Tech (70.1%), Quinnipiac University (73.9%), the University of Missouri at Columbia (78.1%) and George Mason University (81.3%).
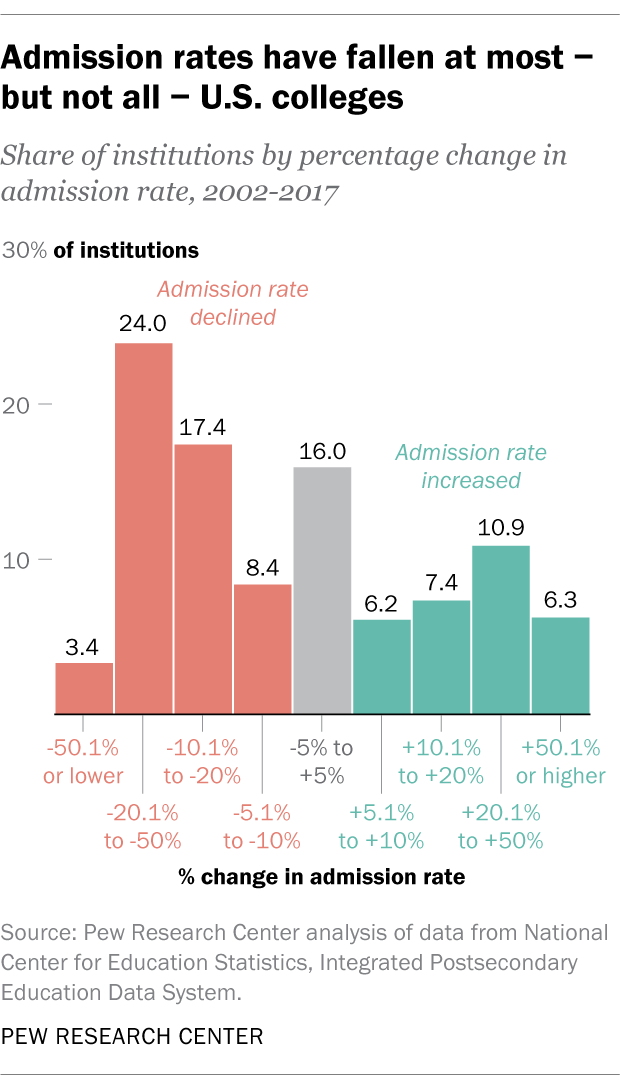
It’s true that admission rates have fallen broadly in recent years. At about 45% of the schools we examined, admission rates were at least 10% lower in 2017 than they were in 2002; there were more modest declines (between 5% and 10%) at another 8% of institutions. But rates at 16% of schools were more or less unchanged (that is, the rate in 2017 was within 5% either way of the 2002 rate), and at nearly 31% of schools, admission rates were actually higher in 2017 than 15 years earlier.
Falling admission rates aren’t necessarily a sign that colleges are simply being pickier about whom they admit. In large measure, rates have fallen because prospective students are applying to more schools than they used to, while the number of available spots for them has grown more slowly. In absolute numbers, schools are making more admission offers than before, but not enough to keep pace with the soaring number of applications.
For all the institutions analyzed, there were nearly 4.9 million total applications in 2002, or about four for every student who ended up enrolling somewhere. By 2017, the total number of applications had more than doubled to almost 10.2 million, or 6.8 per enrolled student. (The total number of enrolled students at the schools in our sample rose 21.4% between 2002 and 2017.)
Schools at all levels of competitiveness have seen increases in application volume, though not in any regular pattern. At all but the most competitive schools – those that admitted fewer than 10% of applicants in 2017 – the number of admissions also has risen. But only among the schools with the highest admission rates – 70% or above – have admissions risen by enough to keep pace with the surge in applications.
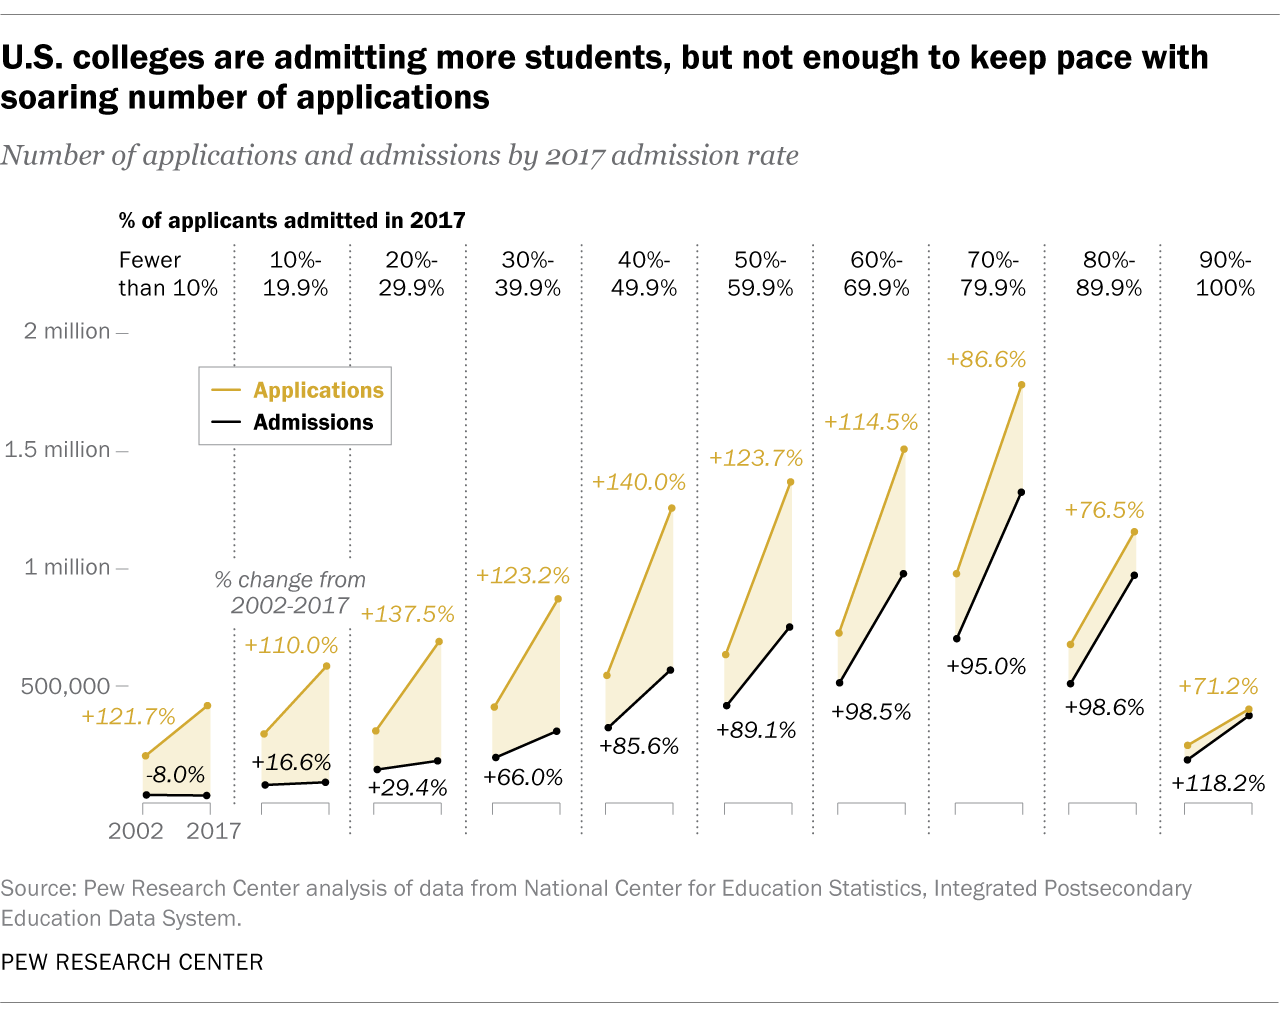
For example, among the more exclusive schools – those that admitted between 10% and 20% of their 2017 applicants – application volume rose 110% between 2002 and 2017, but there were only 17% more admission offers; consequently, the average admission rate for that group fell from 27.1% to 14.4%. But among the schools that admitted more than 90% of applicants, admissions growth outpaced application growth, 118% to 71%. (Among the most competitive schools, application volume more than doubled, but the total number of admissions fell by 8%; as a result, the average admission rate sank from 18% in 2002 to 7.4% in 2017.)
The expansion of the Common Application, which makes it easier for students to apply to multiple schools, doesn’t appear to be behind the increase in application volume. The Common App, as it’s called, is accepted by nearly 800 colleges and universities in the United States and several dozen overseas. Of the 1,364 institutions in our sample, 729 accept the Common App along with (or in some cases instead of) their own application forms; the other 635 use their own forms. Although one might suspect that the ease of applying to multiple schools via the Common App would result in stronger growth in application volume among those schools, there was almost no difference in 2002-2017 growth rates between the schools that used the Common App and those that didn’t.
Of the 4,400 or so degree-granting institutions of higher education in the United States (including branch campuses), roughly 2,800 are four-year colleges and universities. Of that group, about 2,300 are either public or private not-for-profit entities, which was the subset we focused on.
Data on applications, admissions and enrollment came from the Integrated Postsecondary Education Data System (IPEDS), a project of the U.S. Education Department’s National Center for Education Statistics. The analysis looked only at schools for which there were data for both 2002 and 2017. To avoid issues of small numerical changes creating large percentage changes, the analysis was restricted to schools with at least 100 applications in both years. Also excluded were 55 schools that had been two-year institutions in 2002 but had converted to four-year status by 2017. (IPEDS doesn’t collect application and admission data from schools with “open admissions” policies, under which anyone with a high-school diploma or equivalent is admitted.) In the end, 1,364 institutions met all those criteria.
