

A projected 50.7 million pre-K-12 students will return to the classroom in U.S. public schools this fall. They comprise a student body that is more racially and ethnically diverse, more likely to graduate from high school and go on to college, and perhaps more prepared than ever before for a world in which education plays an outsize role in determining their futures.
Here are key findings about America’s students and their experiences:

America’s students are more racially and ethnically diverse than ever, while teachers remain overwhelmingly white. In fall 2015, the share of nonwhite students in U.S. public elementary and secondary schools hit a record 51%. That’s up from 30% in fall 1986. Growth has been especially fast among Hispanic students, who increased from 10% of students in 1986 to 26% in 2015.
At the same time, nonwhites continue to make up a relatively small share of teachers: In the 2015-16 school year, just 20% of public school elementary and secondary teachers were nonwhite, up from 13% in 1987-88. (In 2015, 39% of all Americans were nonwhite.)
While America’s overall student body has become more diverse, many nonwhite students go to public schools where at least half of their peers are of their race or ethnicity. Large shares of blacks (44%) and Hispanics (57%) attend public schools where people of their own race or ethnicity make up at least half the student body. Meanwhile, whites – who continue to make up a larger share of overall U.S. public school students than any other race or ethnicity – tend to go to schools where half or more of students are white.
Students today are more likely to stay in school – and this is particularly true for Hispanics. The overall high school dropout rate in the U.S. has fallen substantially in recent decades, matching a record low of 6% in 2016. Hispanics have accounted for much of that trend: The Hispanic dropout rate, which was the highest (34%) among all analyzed racial and ethnic groups in 1999, dropped to 10% by 2016. By comparison, the fall in dropout rates over the same period has been much less dramatic for blacks, whites and Asians.
Also, the share of Hispanic high school graduates who enroll in college has risen: In 2016, 47% of Hispanic high school graduates ages 18 to 24 were enrolled in college, up from 32% in 1999. Despite these gains, Hispanics trail other groups in earning a bachelor’s degree.

Student involvement in extracurricular activities often differs by family income. Seven-in-ten parents of school-age children say their children return home after school, while 18% say their school-age children participate in after-school activities and 8% say they use an after-care program, according to a fall 2015 survey of parents with children younger than 18. About one-third of parents (32%) with annual family incomes of $75,000 or higher report that their children participate in after-school activities or go to an after-care program, compared with 17% of those with incomes below $30,000. For some parents – including about half (52%) of those with family incomes of less than $30,000 – affordable, high-quality after-school programs can be hard to find.
Family income is also connected to participation in a host of other extracurricular activities. Among parents with annual family incomes of $75,000 or higher, 84% say their children participated in sports or athletic activities in the prior year; 62% say their children took music, dance or art lessons. Smaller shares of parents with incomes of less than $30,000 say their children played sports or took lessons in music, dance or art. Just 14% of parents with incomes of less than $30,000 said their children participated in an organization like the scouts, a smaller share than that of parents with incomes of $75,000 or more (28%).
About half (54%) of American parents say parents can never be too involved when it comes to their children’s education. Yet 43% say too much involvement could be a bad thing. White parents are far more likely than black or Hispanic parents to say too much involvement can be a bad thing, according to the 2015 survey of parents with children younger than 18.
When it comes to assessments of their own involvement in their kids’ education, 53% of American parents of school-age children say they are satisfied with the level of their involvement, though close to half (46%) wish they could be doing more. When asked about specific ways they are involved, more than eight-in-ten parents (85%) say they talked to a teacher about their child’s academic progress in the prior year, and at least six-in-ten attended a PTA or other special school meeting.
American students lag their peers in many other countries in academic achievement and foreign language education. U.S. 15-year-olds ranked 38th out of 71 countries in math and 24th in science in 2015, according to a cross-national test known as the Programme for International Student Assessment (PISA). Among 35 member countries of the Organization for Economic Cooperation and Development, the U.S. ranked 30th in math and 19th in science. Results in a separate test of 4th and 8th graders from the 2015 National Assessment of Educational Progress (NAEP) indicated a dip in math proficiency among U.S. students for the first time since 1990 – but some improvement in science.

There are glaring differences between Europe and the United States when it comes to foreign language education. A median of 92% of European primary and secondary students are learning a foreign language in school, compared with just 20% of K-12 students in the U.S.
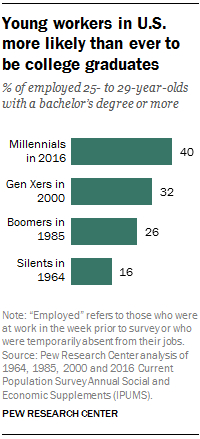
The high educational attainment among young Americans today is reflected in the workforce. Four-in-ten Millennial workers ages 25 to 29 had at least a bachelor’s degree in 2016. (Overall, about one-third – 34% – of Millennials ages 25 to 29 had at least a bachelor’s in 2016.) That compares with 32% of Generation X workers and smaller shares of the Baby Boom and Silent generations when they were the same age. Employed Millennial women (46%) are particularly likely to have a bachelor’s degree or higher in comparison with Gen X women (36%) at the same age. Millennial men in the workforce are also more likely to hold at least a bachelor’s degree than their Gen X counterparts did as young adults.
Note: This is an update to a post originally published on Aug. 10, 2015.
