
Although the overall U.S. poverty rate declined and incomes rose rapidly for the second straight year in 2016, many poor Americans fell deeper into poverty, according to a Pew Research Center analysis of U.S. Census Bureau data.
The official poverty rate was 12.7% last year, close to its pre-Great Recession level (12.5% in 2007). This represents 40.6 million people in poverty. But categorizing people as below or above the poverty line is just one way of looking at economic well-being.
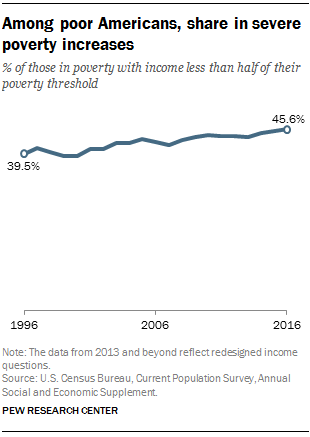
The share of the U.S. poor population in severe poverty – defined by the Census Bureau as those with family or individual incomes below half of their poverty threshold – reached its highest point in at least 20 years. It was 45.6% in 2016, up from 39.5% in 1996. (The share of the total U.S. population in severe poverty has declined over the past two years, alongside the overall poverty rate.)
Poverty thresholds, which are used by the Census Bureau to calculate the U.S. poverty rate, vary across families. The Census poverty thresholds in 2016 ranged from around $12,000 for a single-person family to around $25,000 for a family of four, and higher still for larger families. In comparison, the median household income for all households was $59,039 in 2016. For family households only, median household income was $75,062.
As the share of poor families in severe poverty increased in recent years, these families also saw their incomes fall further below the poverty line. The average family income deficit – that is, the amount a family’s income is below its poverty threshold – was $10,505 for all families in poverty in 2016 (excluding individuals living without other family members). After years of gradual increases, it marks a recent high, up roughly $1,000 from 2000 when the average deficit was $9,509 (after adjusting for inflation).
Among poor families, the average income deficit was largest for those led by a woman with no husband present ($11,139), compared with $9,991 for married couples and $9,288 for families led by a man with no wife present.
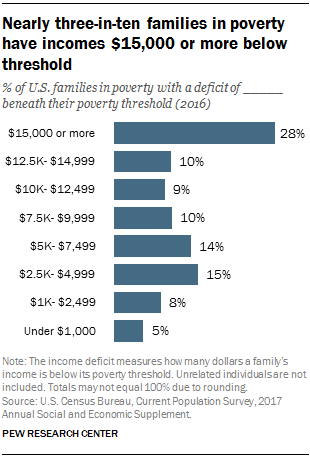
As the average income deficit increased, the share of poor American families living far below the poverty threshold also grew. In 2016, 28.4% of families in poverty had incomes $15,000 or more below their poverty threshold, up from 26.2% in 2015. Nearly 2.3 million families had such severe deficits last year.
The Census data show a different trend for American families who were not in poverty in 2016. For the vast majority of these Americans, the average income surplus – the amount a family’s income is above its poverty threshold – was at least $15,000. The share of families above poverty with a surplus at least that large has gradually ticked upward in recent years, from around 84% in 2010 to 87% in 2016.
Married-couple families above the poverty line had the greatest income surplus, with an average of $97,249. The average income surplus was roughly half as large among families led by a woman with no husband ($46,026). Male-led households with no wife had an average surplus of $62,680.
