
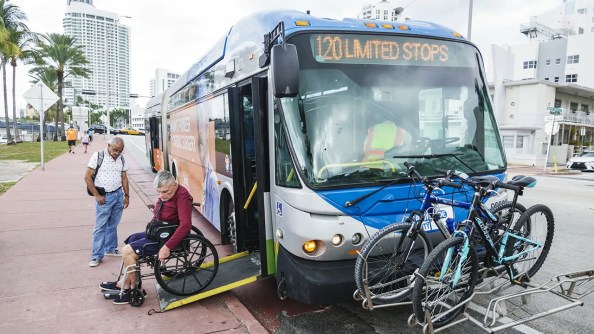
July is Disability Pride Month in the United States, commemorating the passage of the Americans with Disabilities Act more than 30 years ago. Overall, there are about 42.5 million Americans with disabilities, making up 13% of the civilian noninstitutionalized population, according to U.S. Census Bureau data from 2021. This group includes people with hearing, vision, cognitive, walking, self-care or independent living difficulties.
Here are eight facts about Americans with disabilities, based on government data and recent Pew Research Center surveys.
Pew Research Center conducted this analysis to share key facts about Americans with disabilities for Disability Pride Month.
The analysis includes data from the U.S. Census Bureau’s American Community Survey, which defines disability status by asking about six types of disabilities: serious difficulty with hearing, vision, cognition, walking or climbing stairs, and difficulty with self-care and independent living. Other surveys with different definitions have estimated that a considerably larger share of Americans have disabilities.
Occupational data by disability status comes from the Bureau of Labor Statistics.
Federal education data comes from the National Center for Education Statistics. For the purposes of this analysis, disabled students include those ages 3 to 21 who are served under the federal Individuals with Disabilities Education Act (IDEA). Through IDEA, children with disabilities are granted a free appropriate public school education and are ensured special education and related services.
Hispanic Americans in this analysis are of any race. All other racial categories include those who are not Hispanic and identify as only one race.
The public opinion findings in this analysis are based on Pew Research Center surveys. Details about each survey’s questions and methodology are available through the links in this analysis.
Due to the nature of the live telephone surveys, some Americans with disabilities are likely underrepresented in this analysis. The figures reported on technology adoption and internet use are from a phone survey that was conducted via landlines and cellphones and likely under-counted adults who are deaf or have difficulty speaking. Our surveys also do not cover those living in institutionalized group quarters, which may include some individuals who are severely disabled.
Older Americans are significantly more likely than younger adults to have a disability. Some 46% of Americans ages 75 and older and 24% of those ages 65 to 74 report having a disability, according to estimates from the Census Bureau’s 2021 American Community Survey (ACS). This compares with 12% of adults ages 35 to 64 and 8% of adults under 35.
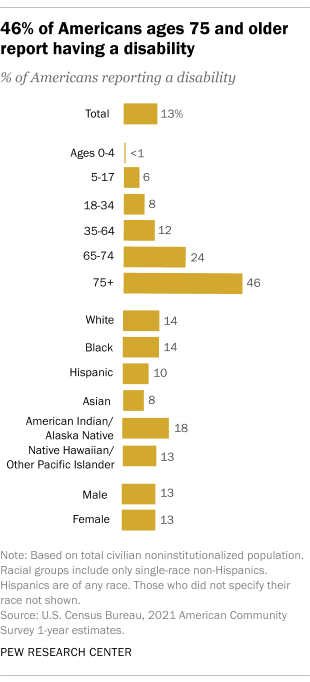
Americans in certain racial and ethnic groups are more likely to have a disability. American Indians and Alaska Natives (18%) are more likely than Americans of other racial and ethnic backgrounds to report having a disability, according to the 2021 ACS estimates. Asian and Hispanic Americans are least likely to say they have a disability (8% and 10%, respectively). The shares of White and Black Americans who report living with a disability fall in the middle (14% each).
The most common types of disability in the U.S. involve difficulties with walking, independent living or cognition. Some 7% of Americans report having serious ambulatory difficulties – struggling with walking or climbing stairs – according to the ACS estimates. Adults ages 75 and older and those ages 65 to 74 are the most likely to report having this kind of disability (30% and 15%, respectively). Much smaller shares of those ages 35 to 64 (6%) and those ages 18 to 34 (1%) say they have an ambulatory disability.
About 6% of Americans report difficulties with independent living – struggling to do errands alone because of physical, mental or emotional problems. And a similar share (5%) report cognitive difficulties – that is, having trouble remembering, concentrating or making decisions. Each of these disabilities is more common among older Americans than among younger age groups.
Americans with disabilities tend to earn less than those who do not have a disability. Those with a disability earned a median of $28,438 in 2021, compared with $40,948 among those without a disability, according to the Census Bureau. (These figures represent employed civilian noninstitutionalized Americans ages 16 and older. They reflect earnings in the previous 12 months in 2021 inflation-adjusted dollars.)
On average, people with disabilities accounted for 4% of employed Americans in 2022, according to the Bureau of Labor Statistics (BLS). They were most likely to be employed in management occupations (12%) and office and administrative support occupations (11%), according to annual averages compiled by the BLS, which tracks 22 occupational categories. Meanwhile, an average of about 10% of workers in transportation and material moving jobs had a disability in 2022.
Disabled Americans have lower rates of technology adoption for some devices. U.S. adults with a disability are less likely than those without a disability to say they own a desktop or laptop computer (62% vs. 81%) or a smartphone (72% vs. 88%), according to a Center survey from winter 2021. The survey asked respondents if any “disability, handicap, or chronic disease keeps you from participating fully in work, school, housework, or other activities, or not.” (It’s important to note that there are a range of ways to measure disability in public opinion surveys.)
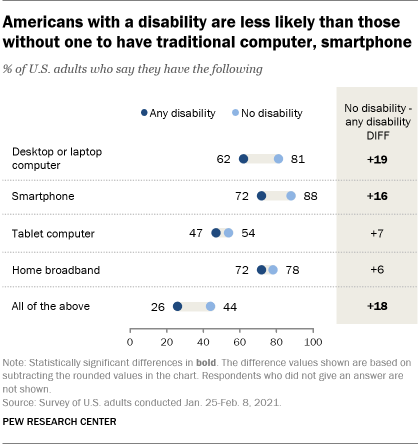
Similar shares of Americans with and without disabilities say they have high-speed home internet. Even so, disabled Americans are less likely than those without a disability to report using the internet daily (75% vs. 87%). And Americans with disabilities are three times as likely as those without a disability to say they never go online (15% vs. 5%).
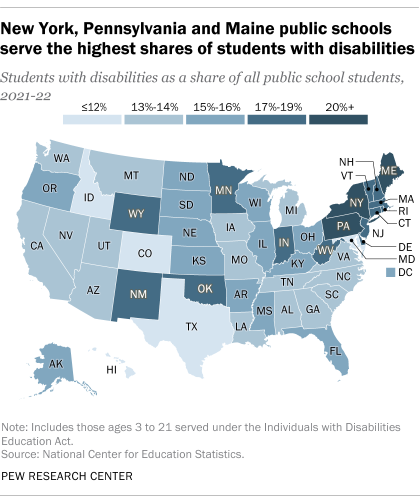
The percentage of U.S. public school students who receive special education or related services has increased over the last decade, according to data from the National Center for Education Statistics. During the 2021-22 school year, there were 7.3 million students receiving special education or related services in U.S. public schools, making up 15% of total enrollment. This figure rose since 2010-11, when 6.4 million disabled students made up 13% of public school enrollment.
In 2021-22, the share of disabled students in public schools varied by state, from about 20% in New York, Pennsylvania and Maine to about 12% in Idaho and Texas. These disparities are likely the result of inconsistencies in how states determine which students are eligible for special education services and some of the challenges involved with diagnosing disabilities in children.
Disabled Americans are much more likely than other Americans to have faced psychological distress during the COVID-19 pandemic, according to a winter 2022 Center analysis that examined survey responses from the same Americans over time.
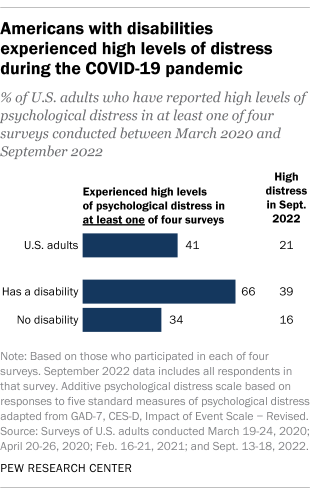
About two-thirds (66%) of adults who have a disability or health condition that keeps them from participating fully in work, school, housework or other activities reported a high level of distress at least once across four surveys conducted between March 2020 and September 2022. That compares with 34% of those who do not have a disability.
Employed Americans generally think their workplace is accessible for people with physical disabilities. Among those who don’t work fully remotely, 76% say their workplace is at least somewhat accessible for people with physical disabilities, according to a Center survey from February. This includes 51% who say it is extremely or very accessible. Another 17% say their workplace is not too or not at all accessible, while 8% are not sure.
Whether or not they consider their own workplace accessible, half of workers say they highly value physical accessibility in the workplace. Workers with disabilities are about as likely as those without disabilities to say this. (Workers are defined as those who are not self-employed and work at a company or organization with more than 10 people.)
Note: This is an update of a post originally published July 27, 2017.

