
The Republican Party made deep inroads into America’s middle-class communities in 2016. Although many middle-class areas voted for Barack Obama in 2008, they overwhelmingly favored Donald Trump in 2016, a shift that was a key to his victory. Meanwhile, Democrats had more success retaining a loose “coalition” of lower-income and upper-income communities.
These findings emerge from a new Pew Research Center analysis that correlates how counties voted with the Center’s estimates of the size of the middle class in U.S. metropolitan areas. Post-election reporting has covered the role of white working-class or college-educated voters in the election, but this analysis focuses on how the middle class shifted allegiance over the course of Obama’s two terms as president.
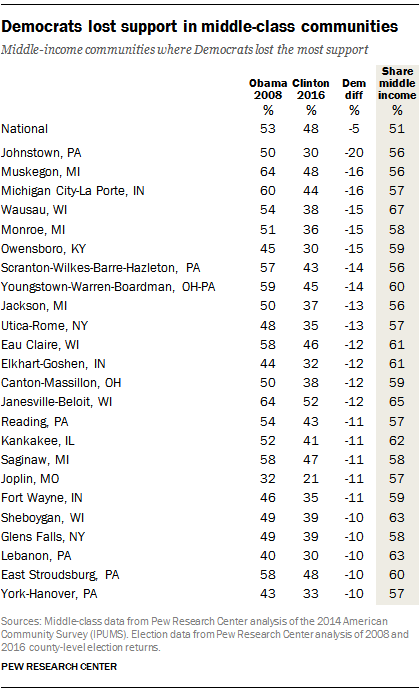
For purposes of this analysis, our standard of measure was metropolitan areas that are middle class, not middle-class voters specifically. Middle-class communities were defined as metropolitan areas in which at least 55% of the adult population lived in middle-income households in 2014. (The national share of the population that is middle class is 51%.)
Of the 221 areas examined, there are 57 such solidly middle-class areas, and they were almost equally split in 2008, with 30 areas voting for Democrats and 27 for Republicans.
In 2016, Trump successfully defended all 27 middle-class areas won by Republicans in 2008. In a dramatic shift, however, Hillary Clinton lost in 18 of the 30 middle-class areas won by Democrats in 2008.
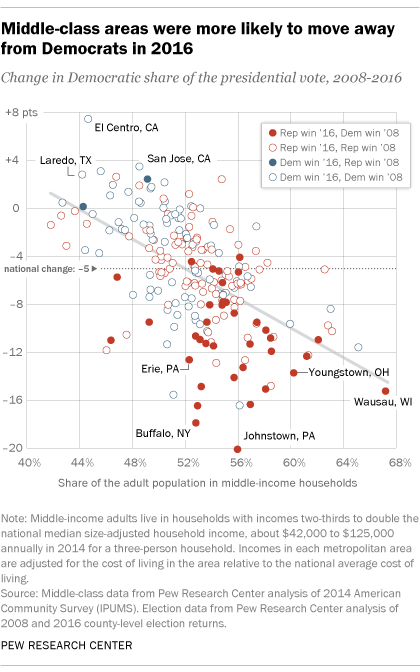
Most of these middle-class communities are located in the Midwest or the Northeast. In many of these areas, Democrats experienced double-digit drops in support, compared with a 5-percentage-point drop nationally. For example, in Johnstown, Pennsylvania, Obama won with 50% of the vote in 2008; in 2016 that share dropped to 30% for Clinton. In heavily middle-class Wausau, Wisconsin, a similar pattern also emerges: 54% voted for Obama in 2008 versus 38% for Clinton in 2016.
In communities with somewhat smaller middle-class shares, Democrats experienced similar losses. Of the 115 such metropolitan areas in which 50% to 55% of the adult population lives in middle-income households, 59 voted Democratic in 2008. But 16 of those 59 areas flipped Republican in 2016.
This leaves 49 metropolitan areas in which the middle class makes up less than 50% of the adult population. Some, such as the Washington, D.C., area, have relatively large upper-income populations, while others, such as Merced, California, have a relatively large lower-income population.
This mix of lower- and upper-income areas scarcely budged in its voting preferences. Some 17 voted Republican in 2008 and 18 did so in 2016. Meanwhile, 32 voted Democratic in 2008 and 31 did the same in 2016. There was only a slight shift in allegiances. Republicans picked up three areas that voted Democratic in 2008 – Springfield, Illinois; Chico, California; and Niles-Benton Harbor, Michigan. Meanwhile, Democrats won two areas they lost in 2008 – Fresno, California, and New Orleans-Metairie, Louisiana.
Overall, Democrats experienced widespread erosion in support from 2008 to 2016. Their share of the vote fell in 196 of the 221 metropolitan areas examined. The loss in support was sufficiently large to move 37 areas from the Democratic column to the Republican column, and, as noted, 18 of these areas were solidly middle class. The slippage seen in 2016 is a continuation of trends that originally appeared in 2012. While Obama largely held on to these same middle-class communities that ultimately supported Trump, 2012 election results show erosion in his margin of support.
Not coincidentally, Democrats also were more likely to have lost ground in manufacturing-dependent areas. Of the 56 communities with a relatively large share of manufacturing jobs, Trump picked up victories in 15 metro areas that had supported Obama in 2008 and held onto another 29, leaving only 12 communities in the Democrats’ column. In these areas, 10% or more of the workers in the area were employed in the manufacturing industry in 2014, compared with less than 7% in metropolitan areas overall, according to Bureau of Economic Analysis data.
Middle-income households are those whose annual income is two-thirds to double the national median, after incomes have been adjusted for household size. In 2014, the national middle-income range was about $42,000 to $125,000 annually for a household of three. Incomes in each metropolitan area are adjusted for the cost of living in the area relative to the national average cost of living. The 221 metropolitan areas covered in the analysis accounted for 74% of the U.S. adult population in 2014. The Center’s earlier report on the middle class in U.S. metropolitan areas describes the methodology in detail, including the choice of metropolitan areas included in the analysis.

