
Donald Trump scored an impressive Electoral College victory Nov. 8 after a campaign that revealed deep divisions – by race, gender and education – that were as wide and in some cases wider than in previous elections, according to an analysis of national exit poll data.
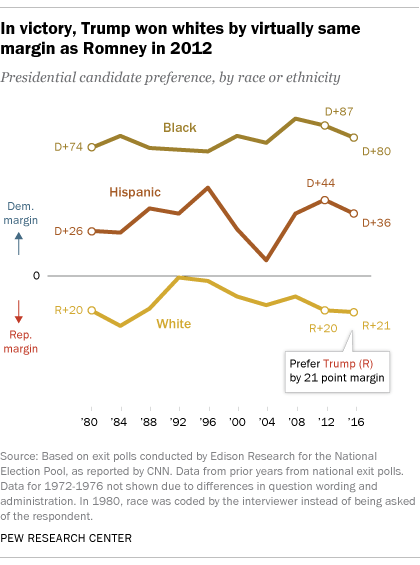
Trump won white voters by a margin almost identical to that of Mitt Romney, who lost the popular vote to Barack Obama in 2012. (Trump appears likely to lose the popular vote, which would make him only the fifth elected president to do so and still win office.) White non-Hispanic voters preferred Trump over Clinton by 21 percentage points (58% to 37%), according to the exit poll conducted by Edison Research for the National Election Pool. Romney won whites by 20 percentage points in 2012 (59% to 39%).
However, although Trump fared little better among blacks and Hispanics than Romney did four years ago, Hillary Clinton did not run as strongly among these core Democratic groups as Obama did in 2012. Clinton held an 80-point advantage among blacks (88% to 8%) compared with Obama’s 87-point edge four years ago (93% to 6%). In 2008, Obama had a 91-point advantage among blacks.
(For more analysis of the 2016 exit polls, see “Hillary Clinton wins Latino vote, but falls below 2012 support for Obama” and “How the faithful voted: A preliminary 2016 analysis.” For an explanation of how exit polls are conducted, see “Just how does the general election exit poll work, anyway?” )
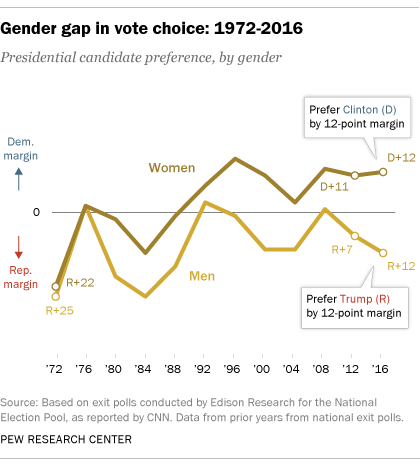
Women supported Clinton over Trump by 54% to 42%. This is about the same as the Democratic advantage among women in 2012 (55% Obama vs. 44% Romney) and 2008 (56% Obama vs. 43% McCain).
By 53% to 41%, more men supported Trump than Clinton (the 12-point margin is identical to the margin by which women supported Clinton). The advantage for Trump among men is larger than the 7-point advantage Romney had in 2012 and much different than in 2008, when men preferred Obama over McCain by a single point. Trump’s performance among men is similar to that of George W. Bush in the 2004 and 2000 elections, where he won men by 11 points in each election.
The gender gap in presidential vote preference is among the widest in exit polls dating back to 1972. However, it is not dramatically higher than in some other recent elections, including the 2000 contest between Bush and Al Gore.
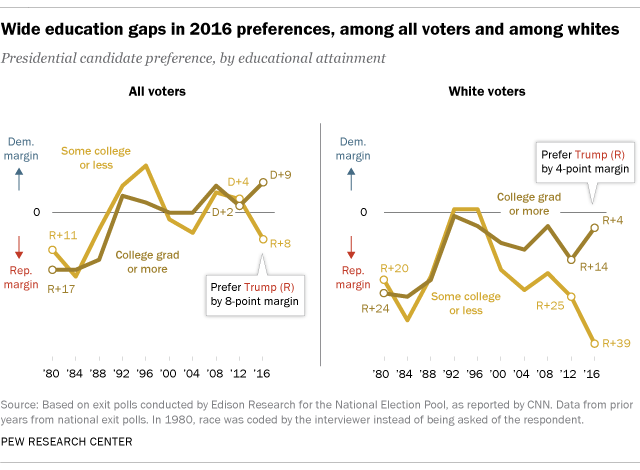
In the 2016 election, a wide gap in presidential preferences emerged between those with and without a college degree. College graduates backed Clinton by a 9-point margin (52%-43%), while those without a college degree backed Trump 52%-44%. This is by far the widest gap in support among college graduates and non-college graduates in exit polls dating back to 1980. For example, in 2012, there was hardly any difference between the two groups: College graduates backed Obama over Romney by 50%-48%, and those without a college degree also supported Obama 51%-47%.
Among whites, Trump won an overwhelming share of those without a college degree; and among white college graduates – a group that many identified as key for a potential Clinton victory – Trump outperformed Clinton by a narrow 4-point margin.
Trump’s margin among whites without a college degree is the largest among any candidate in exit polls since 1980. Two-thirds (67%) of non-college whites backed Trump, compared with just 28% who supported Clinton, resulting in a 39-point advantage for Trump among this group. In 2012 and 2008, non-college whites also preferred the Republican over the Democratic candidate but by less one-sided margins (61%-36% and 58%-40%, respectively).
Trump won whites with a college degree 49% to 45%. In 2012, Romney won college whites by a somewhat wider margin in 2012 (56%-42%). Trump’s advantage among this group is the same as John McCain’s margin in 2008 (51%-47%).
Due largely to the dramatic movement among whites with no college degree, the gap between college and non-college whites is wider in 2016 than in any past election dating to 1980.
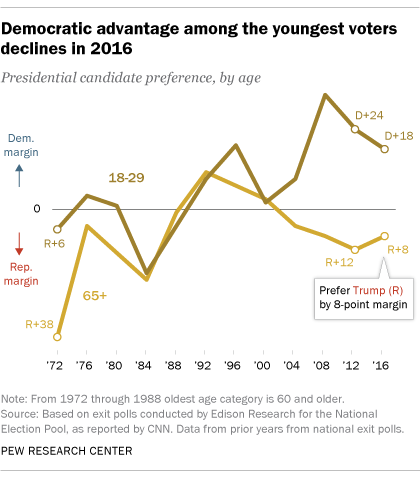
Clinton received a lower share of the vote among young voters (ages 18-29) than Obama received in 2012 or 2008. Young adults preferred Clinton over Trump by a wide 55%-37% margin; by comparison, Obama had a 60%-36% advantage over Romney in 2012 and a 66%-32% advantage over McCain in 2008.
Older voters (ages 65 and older) preferred Trump over Clinton 53%-45%. This is roughly the same advantage for the Republican candidate as in 2012 when older voters backed Romney over Obama 56%-44%.
With Clinton performing worse among young voters than Obama, the overall difference between the preferences of the youngest and oldest voters is smaller than it was in both the 2012 and 2008 elections.
This preliminary analysis reflects data for 2016 as published by CNN.com as of 11 a.m. on Nov. 9, 2016. If data are subsequently re-weighted by the National Election Pool (NEP), the consortium of news organizations that conducts the exit polls, the numbers reported here may differ slightly from figures accessible through the websites of NEP member organizations.
Related posts:
