
Pew Research Center’s new Religious Landscape Study, the first since our 2007 study, draws on a massive sample size of more than 35,000 Americans to offer a detailed look at the current religious composition of U.S. adults. The size of the sample enables us to explore relatively small religious groups (including specific Christian denominations) as well as state- and metropolitan area-level data.
In addition to the full report, the findings of the study can be explored at a new interactive website. Here are a few of the key findings:
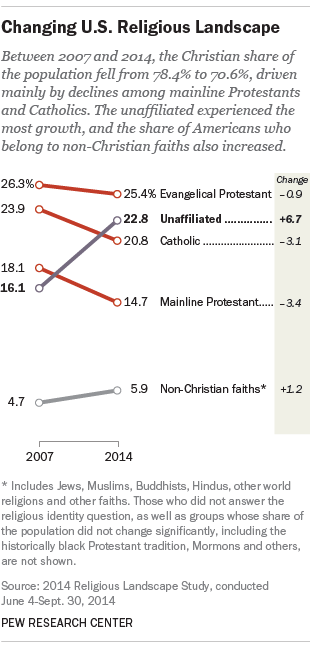
Christians are declining, both as a share of the U.S. population and in total number. In 2007, 78.4% of U.S. adults identified with Christian groups, such as Protestants, Catholics, Mormons and others; seven years later, that percentage has fallen to 70.6%. Accounting for overall population growth in that period, that means there are roughly 173 million Christian adults in the U.S. today, down from about 178 million in 2007.
Within Christianity, the biggest declines have been in the mainline Protestant tradition and among Catholics. Mainline Protestants represented 14.7% of U.S. adults in 2014, down from 18.1% in 2007, while the Catholic share of the population fell to 20.8% from 23.9% over the same period. By comparison, evangelical Protestants have been more stable, declining only about 1 percentage point between 2007 and 2014 (from 26.3% to 25.4%).
The decline of Christians in the U.S. has corresponded with the continued rise in the share of Americans with no religious affiliation (religious “nones”). People who self-identify as atheists or agnostics (about 7% of all U.S. adults), as well as those who say their religion is “nothing in particular,” now account for a combined 22.8% of U.S. adults – up from 16.1% in 2007. The growth of the “nones” has been powered in part by religious switching. Nearly one-in-five U.S. adults (18%) were raised as Christians or members of some other religion, but now say they have no religious affiliation.
There are clear differences between certain demographic groups when it comes to religious affiliation. For example, younger adults are far more likely than older Americans to identify as religious “nones,” and men are more likely than women to be religiously unaffiliated. But despite these differences, the major trends seen in American religion since 2007 – the decline of Christians and rise of the “nones” – have occurred in some form across many demographic groups, including men and women, older and younger Americans, and people with different levels of education and different races and ethnicities.
The share of Americans who identify with non-Christian faiths, such as Islam and Hinduism, has grown modestly in recent years, from 4.7% in 2007 to 5.9% in 2014. Muslims now account for 0.9% of the U.S. adult population (up from 0.4% in the 2007 Landscape Study), while Hindus make up 0.7% of U.S. adults (up from 0.4% in 2007).
