

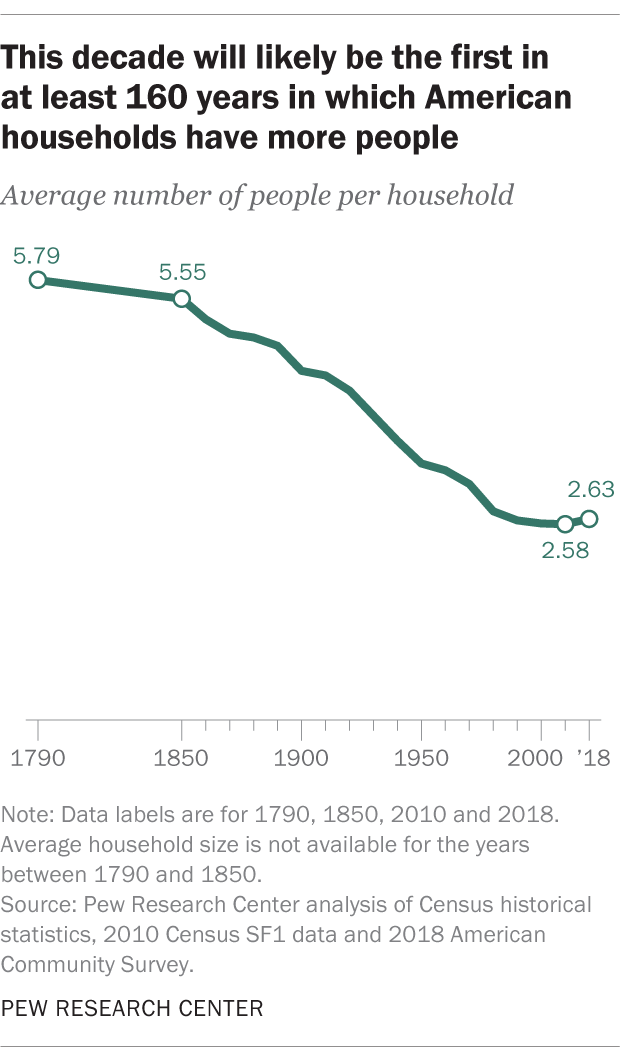
Over the course of the nation’s history, there has been a slow but steady decrease in the size of the average U.S. household – from 5.79 people per household in 1790 to 2.58 in 2010. But this decade will likely be the first since the one that began in 1850 to break this long-running trend, according to newly released Census Bureau data. In 2018 there were 2.63 people per household.
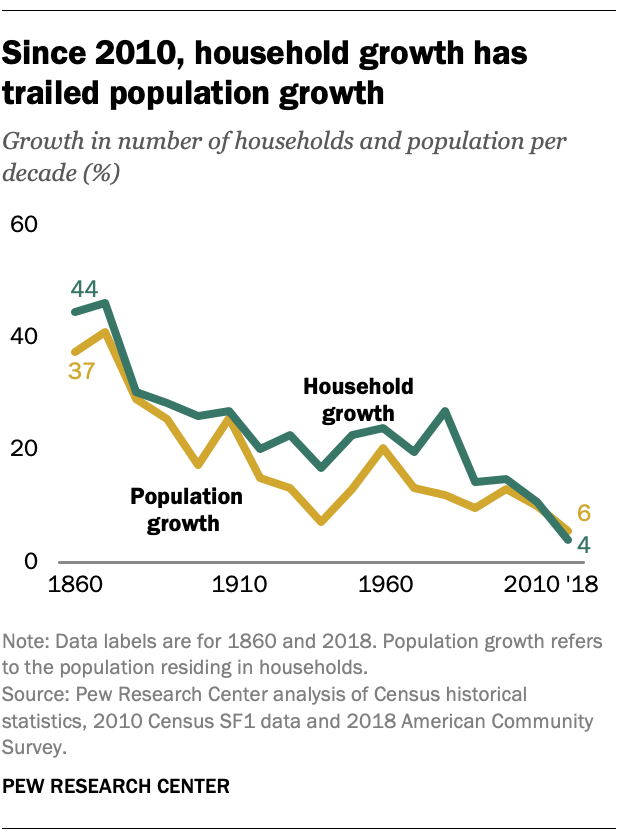
Households are increasing in size mathematically because the growth in the number of households is trailing population growth. The newly released data indicates that the population residing in households has grown 6% since 2010 (the smallest population growth since the 1930s), while the number of households has grown at a slower rate (4%, from 116.7 million in 2010 to 121.5 million in 2018).
The increase in household size is significant because it could have implications for national economic growth. Rising household size reduces the demand for housing, resulting in less residential construction and less demand for home appliances and furniture. In general, it leads to a less vigorous housing sector – fewer apartment leases and home purchases, as well as less spending related to housing, such as cable company subscriptions and home accessories suppliers.
The long-running decline in American household size can be tied to at least two demographic trends. The size of immediate families has declined over time as women have had fewer children. In 1790, the total fertility rate of white women was 7.0 births (meaning a white woman had, on average, seven births in her lifetime). By 1870 it had fallen to 4.6 births, and by 1940 it stood at 2.2. For black women, the total fertility rates were 7.7 and 2.8 births for 1870 and 1940, respectively.
Furthermore, the rise of the nuclear family resulted in fewer extended family living arrangements and smaller households. In 1850, almost 70% of those ages 65 and older lived with their adult children. By 2000, fewer than 15% did so. These demographic changes may reflect more fundamental societal changes such as industrialization, urbanization, rising living standards (especially for older adults) and constricted immigration in the first half of the 1900s.
This decade’s likely upturn in average household size reflects several demographic trends.
A growing share of the population resides in multigenerational family households. By 2016, 20% of Americans lived in a multigenerational household, up from 12% in 1980. On average, these families have about two more members than other households. This partly reflects the country’s increasing racial and ethnic diversity. The Asian, black and Hispanic populations are more likely to live in multigenerational households than non-Hispanic whites.
In addition, more Americans in the wake of the Great Recession are “doubled up” in shared living quarters. This arrangement refers to the presence of an “extra adult” in the household, who might be an adult child or parent of the householder, or simply a roommate or boarder in the household. In 2019, 20% of households are shared households, up from 17% in 2007.
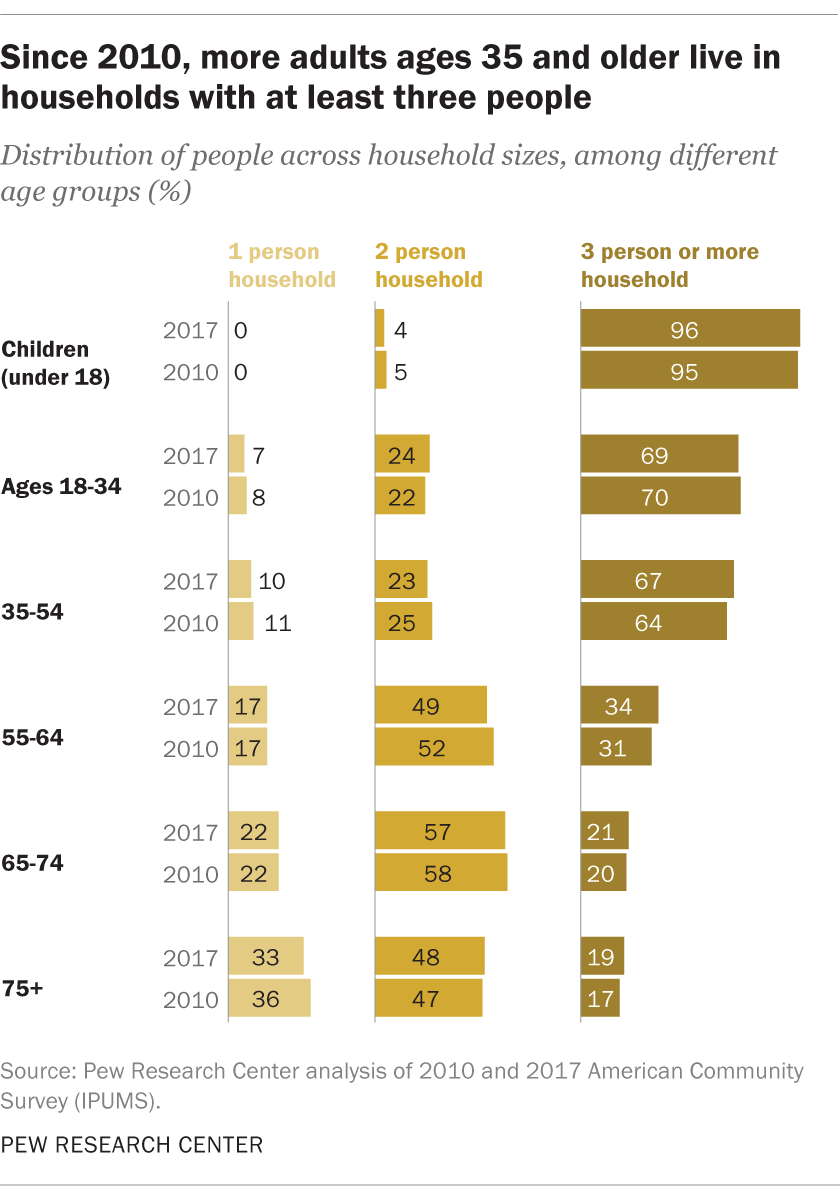
Most age groups are living in larger households this decade. The change is most apparent for adults ages 35 and older. For example, in 2017, 67% of 35- to 54-year-olds lived in a household with three or more people, an increase from 64% in 2010. A similar increase in households of three or more is apparent among 55- to 64-year-olds.
While bigger households may be bad for the wider economy, they are often advantageous for the households themselves. The additional household members may be working adults who contribute to household income. The widely noted arrangement of young adults residing with their parents demonstrates the economic benefits of bigger households. Last year, 6% of families that had at least one adult child age 25 to 34 living in the home were in poverty. The Census Bureau estimates that the poverty rate for these families would have been 11.5% if the young adult were not a member of the household.
Average household size will likely exceed 2.58 persons in 2020 if the current pace of household growth holds.
Note: There are two ways to look at trends regarding households in the U.S. In this analysis, which treats all households equally, the average household has 2.6 people. Other analyses look at it through the prism of the average person and find that the average person lives in a household with 3.4 people. The average based on people gives more weight to larger households since there are more people residing in them.
