
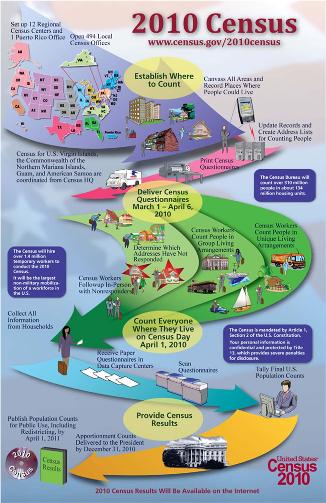
On Jan. 21, 2010, the Pew Research Center hosted a conversation about the 2010 Decennial Census with Director of the U.S. Bureau of the Census Robert Groves and a panel of experts. Groves discussed the operational flow of the 2010 Census, design features intended to increase participation, the department’s communications campaign, real-time monitoring/management, and evaluation of the quality of the census. The session was jointly sponsored by the center, the Washington chapter of the American Association of Public Opinion Research and the Washington Statistical Society.
Speakers:
• Robert Groves, U.S. Census Bureau director, formerly director of the University of Michigan Survey Research Center.
• Constance F. Citro, Director, Committee on National Statistics
• Jeffrey Passel, Senior Demographer, Pew Research Center
• Joseph Salvo, Director, Population Division, New York City Department of City Planning
Moderator: Scott Keeter, Director of Survey Research, Pew Research Center
In the following edited excerpt, ellipses have been omitted to facilitate reading. Listen to the 50-minute audio of Groves’ presentation, including an introduction and presentation of survey findings by Pew Research Center President Andrew Kohut.
ROBERT GROVES: When I saw that this was sponsored by AAPOR and WSS and I see tons of my survey researcher friends out there, I thought you’d be more interested in one particular challenge of the 2010 Census, and that is to get participation at the levels we need to have a good census. So I concentrate my remarks on that.
[after I came to the Census Bureau]
A big part of the design to get greater participation is a communications campaign that’s rolling out right now. The first national ad was on Sunday on the Golden Globe Awards. The 2010 design is an empirically oriented design in that there’s a wonderful data set that you can actually download that has tract-level data on 2000 participation rates and a lot of other variables.
That data set was supplemented with other survey data to guide the construction of a communications campaign and outreach campaign. My colleagues studied the correlates — the influences, if you will — on census participation, and through those influences identified levers that could be pulled in an advertising campaign to try to change the attitudes and behavior of the population.
[These]
[file]
[questionnaires]
[T]
[This process]
Reducing the burden of response
[see the form at 2010.census.gov ]
[Next]
[The]
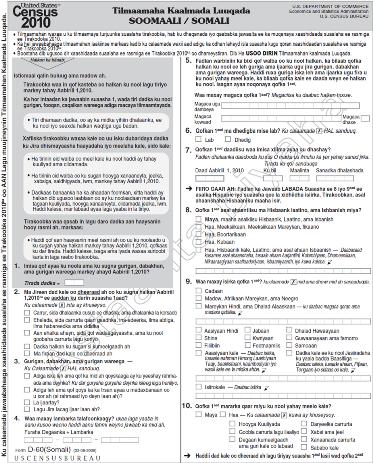
Dealing with Language Impediments
[also]
[the example on the right]
[American Community Survey]
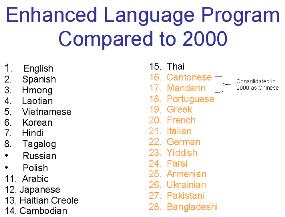
In our advertising campaign, we cover 28 different languages. That gets you up to 99.4 percent. The language assistance guides go up to 59 languages; you’re at 99.7. To get to 99.8 – you can see the falloff – you’d have to go to 101 languages. On our staff throughout the country now, we have people who speak 124 different languages. In the L.A. school system the kids speak 127 languages. And what is New York City, Joe?
JOSEPH SALVO: We’ve maxed out the list. We use 175 now.
[can make]
Why? Well, some of them can’t read the English form that we mail them, so it makes all sorts of rational sense to take language as a big design feature and attack that through reducing the burden of different languages. I’m quite hopeful that our advertising in multiple languages and our supply of different language assistance guides may make a difference in this.

[an idea]
Tract-based Outreach and Partnerships
Now, a cool thing that happened, in my personal opinion, is that the planning database, this tract-level database, was actually used for part of the outreach. We have people in all of our regions called partnership specialists, and one effect of the stimulus money was to quintuple the size of this staff. These people sat down with our operation staff in every census office, and for all of the tracts that were labeled “hard to count,” they developed a plan.
They drove every street of the tract. They marked where the churches were, where the community centers were; if people tend to hang out at the barber shop or the convenience store. Was there a residents association in the place? Was it a strong faith-based organized community? Were there important businesses that gave back to the community? Then they sat down and said, how can we use these resources on this tract to increase the response rates in that tract? A tract is about 4,000 people — a geographically clustered area. We have a database now, so for every one of these tracts we have a set of checkmarks on what is going to happen in that tract.
Let me say a bit about these partners. A partnership is a voluntary agreement with another organization. No money changes hands. It’s essentially an organization saying, okay, we get it, we get your message. We think our group will be benefited by full census participation. We’ll help you get the word out.
Some of these groups are as small as a little residents association. Some of them are national organizations like Target and Best Buy. So pretty soon, when you walk into your local Best Buy, you know that panel of plasma screens at the back? It will have the census logo. And pretty soon, on the Sunday supplement for Target, there’s going to be a page that reminds you that the census form is coming. These are groups that believe it’s useful for their mission to have strong census participation, and we depend on them. We have over 160,000 now.
Integrated Communications Campaign
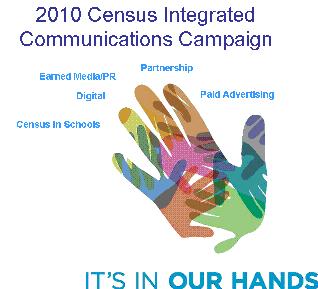
[shown in the graphic]
[and]
I was in a Census in Schools in Delaware and the characters under contract don’t talk. They just sort of walk around. And they’re like six-and-a-half feet tall — really big. So we enter this fifth-grade room and the kids are all in their census t-shirts. Rosita starts lumbering down one of the aisles and there was a little girl working on her census form and she looked up suddenly and Rosita was right in her face. The girl screams. So they had to kind of escort Rosita back. It was a little too much Rosita.
Now, why are we doing this? We have learned over and over and over again that the sons and daughters of new immigrant groups, through school education, are a wonderful conduit of both English language skills and the communication of the new society to the whole family. When they understand the census, understand safety guidelines of the census, it helps family participation.
[They]
I’ll talk more about paid advertising. This is a fairly big campaign. For advertisers, if you’re in the advertising business, it’s a weird campaign because if you ask the question, “What’s your target market?” It’s everybody. So it’s an odd campaign in that you’re not going after a particular slice. Because we’re trying to reach everyone, we have disproportionately spent locally rather than nationally. We are disproportionately spending in language groups. We are trying to get the message out to those that, in past, cooperated and participated at lower levels.
It is focused on three sorts of things: increasing the mail response rate — for every 1 percentage point that we raise the mail response rate through this advertising campaign, we will reduce the total cost of the census by about $85 million. All we have to do is reduce this thing by 1 percentage point and it pays for itself almost. We’re really close to getting those kind of returns.
[the form]
[In]

[Commercials have been designed for each subgroup.]
[our]
So every day we can actually build a little predictive model. We can watch how the predictors are changing. We can see whether awareness is rising in all the subgroups of the population. And if we get really clever about this, we can tweak the advertising if one subgroup is lagging in getting the message that we’re trying to deliver.
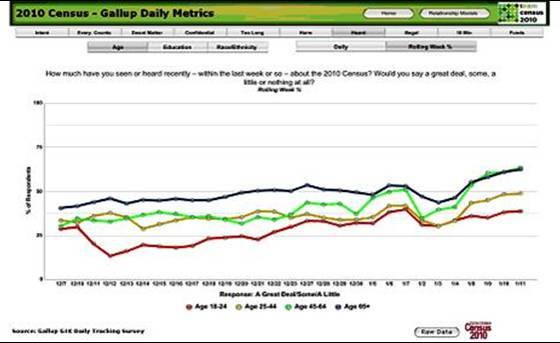
[The chart shows the data we’ve collected so far on]
[random digit dialing]
We’re running multinomial logistic regression models every day. The dependent variable is the behavioral intention to complete the form. The independent variables are these knowledge and attitude questions. And then we have three models: just straight knowledge/attitude; straight sociodemographic; then we put them together. We’re beginning to look at interaction models. We’re asking questions like, “Are the different attitudes more or less important drivers for different subgroups? Are those attitudes moving in the right direction, beneficial to census participation?” If we’re smart, we’ll learn how to tweak the advertising campaign to make real-time adjustments on it.
Tracking Participation
[on the Census Bureau Web site]
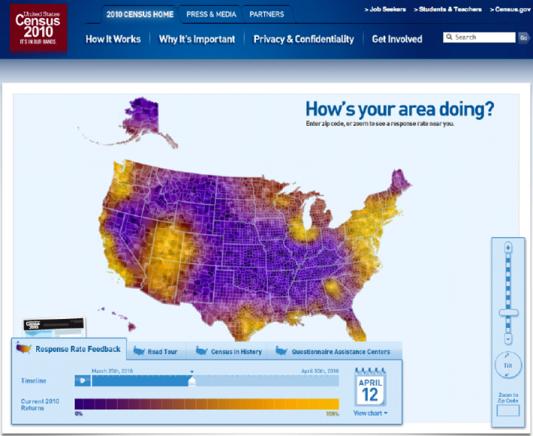
[what we call]
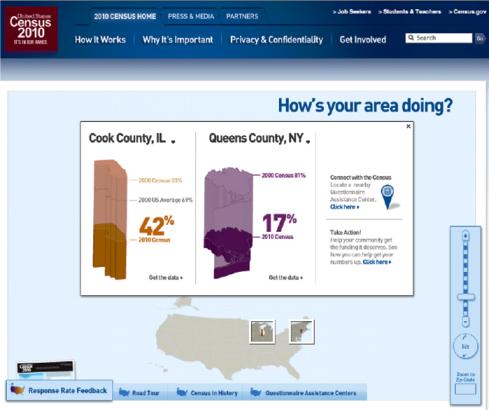
[percent]
[we’ll be]
And we have our partners ready to go into tracts that are unusually low performers, surprise-low performers, and do things for a three-week period to get the forms back. This is new. Whether it will work, since it’s never been done before, it won’t work perfectly; it’ll be ugly in certain areas. I think it makes sense to try it. And we’re calling this the “April Blitz.”
The big thing that we have this decade that we had last decade also is trying to get a handle on the undocumented immigrant population. This is a component of demographic analysis that’s really hard to estimate. What we are planning to do actually, in an honest portrayal of demographic analysis this decade, is to present several different estimates of counts for these subgroups based on different assumptions; different logical, plausible options for the value of key components. It will be an honest portrayal — what we know and don’t know — and hopefully be more useful and less susceptible to misunderstandings.
Post-Census Evaluation
We also do a very large post-enumeration survey. For some reason, the name changes every decade. This decade, it’s called “Census Coverage Measurement.” But it is, in essence, a very large post-censal sample survey independently done of the census. So if you go into our local census offices now, there’s always a locked subset of the census office. It’s a room filled with people who are preparing to do this. They are like the Secret Service of the census.
As you know, the 2010 Census will not have a statistical adjustment. This is something that became crystal clear from a Supreme Court case at the end of the ’90s. We are using this post-enumeration survey to evaluate. What’s new about this is that we’re going to be able to track components of census coverage at certain levels.
We’re also going to be able to break down the value of a census operation. For example, the mail-out areas versus the areas where we drop off a questionnaire, nonresponse follow-up as an operation, to assess its value in affecting differential undercount. That’s something new; we’ll see how well it goes.

[but]
It is not a pretty process. It is a lot like all sample surveys that I’ve done: The data set often looks a lot better than the interviewing and all the horrible things that happen when people try to get information from people. It’s an ugly process. There are going to be things that will happen over the next few weeks that I can’t predict, you can’t predict; they’re going to happen, though. And they’re mainly bad things, it seems.
For more on the census, check out “All Things Census,” a gathering place for frequent postings about census methodology, findings and resources at census.pewresearch.org/pewresearch-org/social-trends
