Today, there are more than 18 million living veterans in the United States, representing about 6% of the country’s adult population. Here are key facts about Americans who have served in the military and how this population is changing, based on data from the Department of Veterans Affairs, the U.S. Census Bureau and Pew Research Center surveys.
Pew Research Center conducted this analysis to understand the makeup of the U.S. veteran population and how it will change in coming decades.
Information for this analysis comes from the Department of Veterans Affairs, the U.S. Census Bureau and previously published Pew Research Center data, including a survey conducted March 13-19, 2023. More information on that survey’s methodology, can be found in the originally published analysis.
Racial and ethnic categories are taken from VA population projections. All racial groups include Hispanic adults unless specified. Hispanics are of any race.
Veterans who served in the last 30 years make up the largest number of living veterans, according to population model estimates from the VA. Veterans from the Gulf War era, which spans from August 1990 through the present, surpassed Vietnam-era veterans in 2016. (Veterans who served in multiple eras are counted only in the earliest one.)
Population estimates for 2023 show:
- 7.8 million living U.S. veterans, or 43%, served in the Gulf War era.
- 5.6 million living veterans (30%) served during the Vietnam War era from 1950 to 1973.
- Around 767,000 veterans who served during the Korean conflict in the 1940s and 1950s are alive today. They make up 4% of all living veterans.
- Fewer than 120,000 World War II veterans are alive today, making up less than 1% of all living veterans.
As of 2023, roughly three-quarters (78%) of veterans served during wartime, and 22% served during peacetime. (Veterans with both types of service are only counted in wartime.)
The share of the U.S. population with military experience has declined, according to data from the U.S. Census Bureau. In 1980, about 18% of U.S. adults were veterans, but that share fell to 6% in 2022.
This happened alongside a decrease in active-duty personnel after the military draft ended in 1973. The number of active-duty service members dropped from 3.5 million in 1968, during the military draft era, to about 1.3 million in today’s all-volunteer force. Active-duty service members now comprise less than 1% of all U.S. adults.
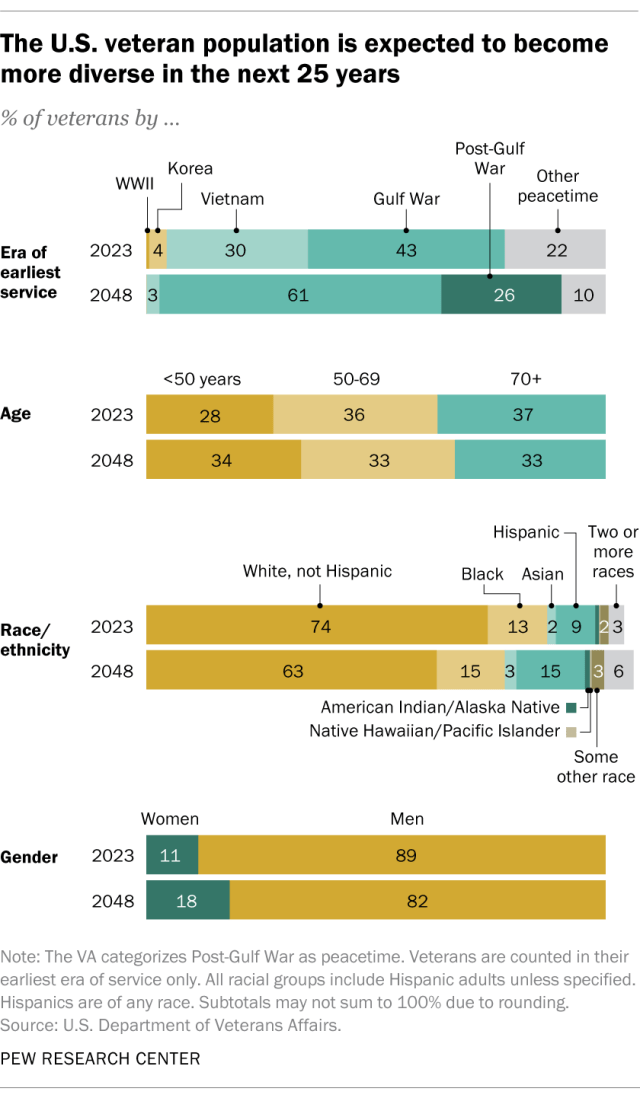
The VA projects that the number of living veterans will continue to decline over the next 25 years. The department estimates that the number of veterans will drop from today’s 18.3 million to 12.1 million in 2048 – a decrease of about 34%. By then, Gulf War-era veterans are projected to make up the majority of living veterans.
As the number of veterans declines over the next 25 years, their demographics will shift, VA population models show. Women, Hispanic and Black adults, and adults under 50 will all make up larger shares of the total veteran population.
- Gender: The share of women veterans will increase from 11% this year to 18% in 2048. The overall number of women veterans is also expected to increase, from around 2 million to about 2.2 million. The number of male veterans, on the other hand, is projected to drop from about 16.2 million in 2023 to just under 10 million in 2048.
- Race and ethnicity: The share of non-Hispanic White veterans is projected to drop from 74% to 63%. The share of Hispanic veterans is expected to roughly double from 9% to 15%, while the share who are Black is expected to increase from 13% to 15%. This trend is in line with projections for the U.S. population overall.
- Age: Today, 28% of veterans are younger than 50, compared with a projected 34% in 2048, even as the share of older Americans overall is expected to grow.
Fewer members of Congress have military experience than in the past, according to a Center analysis of the 118th Congress conducted after the 2022 congressional elections. In the current Congress, 18% of representatives and 17% of senators are veterans, down drastically from just a few decades ago.
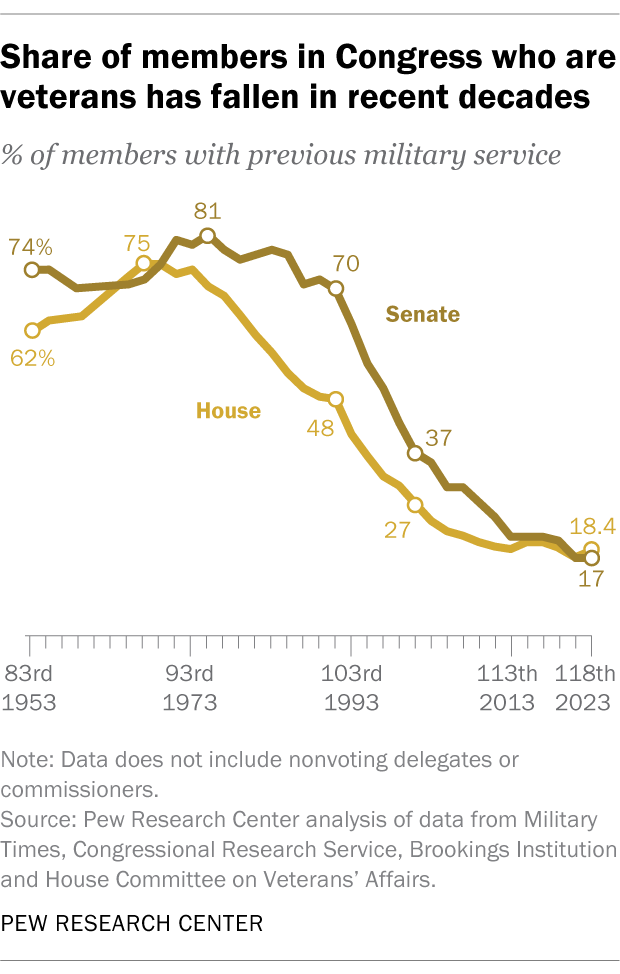
The share of senators who are veterans reached a post-Korean War peak of 81% in 1975, while the share among House members peaked in 1967 at 75%.
In recent elections, both Democrats and Republicans have made concerted efforts to recruit veterans for congressional races. In the current Congress, 18 freshman lawmakers are veterans.
Most Americans view the Department of Veterans Affairs favorably, according to a spring 2023 Center survey that asked Americans about 16 federal agencies. A slim majority of U.S. adults (56%) say they have a favorable opinion of the VA, 28% have an unfavorable view and 16% aren’t sure.
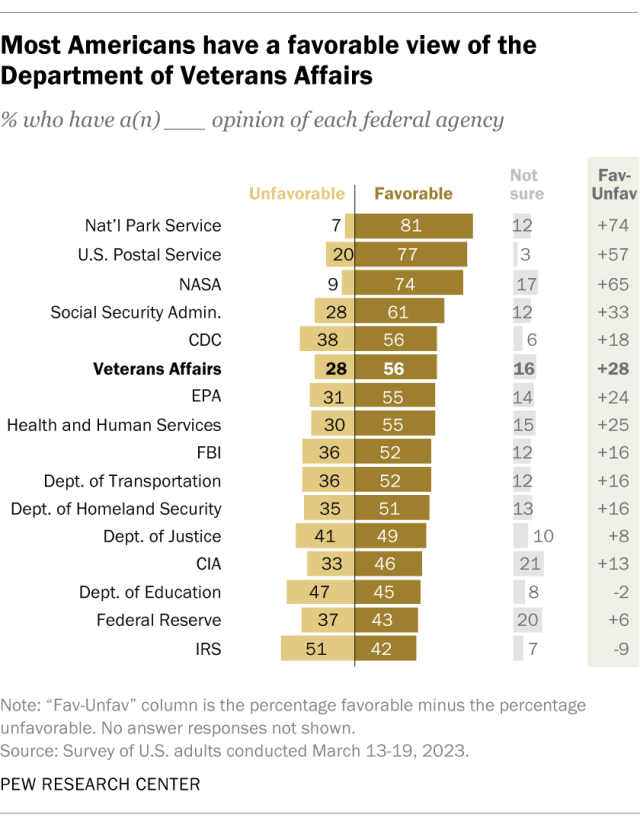
As with many of the agencies and departments asked about in the survey, there were partisan differences in opinions of the VA. While similar shares of partisans expressed approval of the VA, a larger share of Republicans and Republican-leaning independents expressed dissatisfaction than Democrats and Democratic leaners (31% vs. 25%).
This is an update of a post originally published on April 5, 2021.
