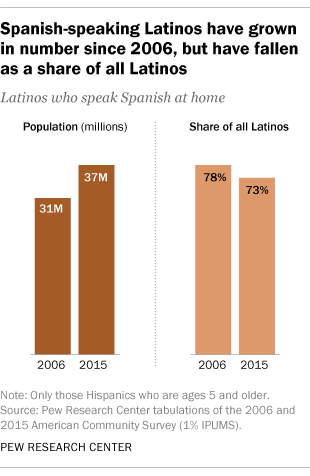
More than 37 million Latinos in the U.S. speak Spanish at home, making it the country’s most common non-English language. But while the number of Latinos who speak Spanish at home continues to increase due to the overall growth of the Latino population, the share of Latinos who speak the language has declined over the past decade or so: 73% of Latinos spoke Spanish at home in 2015, down from 78% in 2006, according to a Pew Research Center analysis of Census Bureau data.
The national decline in Spanish use among Latinos extended to all of the top 25 U.S. metro areas with the largest population of Latinos ages 5 and older. The San Antonio-New Braunfels and Phoenix-Mesa-Scottsdale metro areas had some of the largest declines, with the shares who spoke Spanish in each declining by 9 percentage points. Some of the smallest declines came in the Washington-Arlington-Alexandria, McAllen-Edinburg-Mission, Sacramento-Roseville-Arden-Arcade and Miami-Fort Lauderdale-West Palm Beach metro areas, where the share who spoke Spanish at home declined by about 2 percentage points each from 2006 to 2015. (Click here for a sortable table of Spanish use by metro area.)
Despite this drop-off in use, most Latinos agree that speaking Spanish is a vital skill. In a 2011 Pew Research Center survey, nearly all Latinos said it was important that the next generation of Latinos in the U.S. speak Spanish. Yet many Latinos (71%) say it’s not necessary to speak Spanish to be considered Latino, a 2015 survey found.
About half of all Latinos who spoke Spanish at home in 2015 lived in the 10 metro areas with the largest populations of Spanish-speaking Latinos. These metro areas accounted for about 18.5 million Latino Spanish speakers. (Just three states – California, Texas and Florida – included 57% of Spanish-speaking Latinos in the U.S.)
The use of Spanish by Latinos can vary greatly by metro area, in part because immigrants are much more likely to speak Spanish than those born in the U.S. The large presence of immigrants in the Miami metro area, for example, helps explain why a far greater share of Latinos there speak Spanish than in metro areas like Denver-Aurora-Lakewood, where the vast majority of Latinos are U.S. born.
About nine-in-ten Hispanics spoke Spanish at home in Miami (90%) and McAllen (90%), the highest rates in the nation among the top 25 Latino metro areas. The Latino population in Miami had the highest share of immigrants (64%) among the nation’s largest metro areas. In McAllen, immigrants made up only 32% of Latinos, though the metro area’s shared border with Mexico helps explain the widespread use of Spanish there.
By contrast, in the Denver metro area, 57% of Latinos spoke Spanish, the lowest share among the metro areas analyzed. Sacramento and San Antonio also had low shares, with about 60% of Latinos speaking Spanish at home in each metro area. These areas had some of the lowest immigrant shares among their Latino populations – 29% in Denver, 30% for Sacramento and 16% in San Antonio – which helps account for their low Spanish-speaking shares.
Spanish use has also become less widespread among Latinos in the nation’s two largest metro areas by Latino population. In Los Angeles-Long Beach-Anaheim, home to more than 5.5 million Latinos ages 5 and older, 80% spoke Spanish at home in 2015, a decline of 3 percentage points from 2006. New York-Newark-Jersey City (3.6 million Latinos ages 5 and older) saw an even larger decline, with the share who spoke Spanish dropping from 85% in 2006 to 80% in 2015.
Spanish language use in major U.S. metro areas
Spanish speaking at home has declined in top 25 metros with largest Hispanic population
| Metro area | Spanish-speaking population (2006) | % of Hispanics speaking Spanish at home (2006) | Spanish-speaking population (2015) | % of Hispanics speaking Spanish at home (2015) | Percentage point change, 2006-15 |
|---|---|---|---|---|---|
| Atlanta-Sandy Springs-Roswell, GA | 341,881 | 86% | 429,651 | 80% | -6% |
| Austin-Round Rock, TX | 290,694 | 71% | 388,989 | 66% | -5% |
| Boston-Cambridge-Newton, MA-NH | 250,265 | 81% | 350,968 | 76% | -5% |
| Chicago-Naperville-Elgin, IL-IN-WI | 1,359,455 | 84% | 1,478,308 | 77% | -6% |
| Dallas-Fort Worth-Arlington, TX | 1,165,796 | 83% | 1,426,774 | 79% | -4% |
| Denver-Aurora-Lakewood, CO | 283,918 | 60% | 344,245 | 57% | -4% |
| El Paso, TX | 472,168 | 88% | 518,138 | 83% | -5% |
| Fresno, CA | 257,795 | 69% | 303,248 | 66% | -3% |
| Houston-The Woodlands-Sugar Land, TX | 1,336,720 | 84% | 1,690,224 | 77% | -6% |
| Las Vegas-Henderson-Paradise, NV | 333,460 | 79% | 446,552 | 76% | -3% |
| Los Angeles-Long Beach-Anaheim, CA | 4,239,233 | 83% | 4,429,478 | 80% | -3% |
| McAllen-Edinburg-Mission, TX | 504,184 | 92% | 620,426 | 90% | -2% |
| Miami-Fort Lauderdale-West Palm Beach, FL | 1,762,993 | 92% | 2,208,303 | 90% | -2% |
| New York-Newark-Jersey City, NY-NJ-PA | 3,145,559 | 85% | 3,555,706 | 80% | -5% |
| Orlando-Kissimmee-Sanford, FL | 329,967 | 84% | 501,421 | 79% | -5% |
| Philadelphia-Camden-Wilmington, PA-NJ-DE-MD | 239,852 | 75% | 332,952 | 67% | -8% |
| Phoenix-Mesa-Scottsdale, AZ | 790,635 | 74% | 823,349 | 66% | -9% |
| Riverside-San Bernardino-Ontario, CA | 1,150,035 | 72% | 1,393,308 | 68% | -4% |
| Sacramento–Roseville–Arden-Arcade, CA | 203,289 | 61% | 260,441 | 59% | -2% |
| San Antonio-New Braunfels, TX | 669,898 | 69% | 709,015 | 60% | -9% |
| San Diego-Carlsbad, CA | 612,812 | 78% | 742,116 | 74% | -4% |
| San Francisco-Oakland-Hayward, CA | 571,628 | 76% | 666,058 | 71% | -5% |
| San Jose-Sunnyvale-Santa Clara, CA | 297,222 | 75% | 322,811 | 70% | -5% |
| Tampa-St, Petersburg-Clearwater, FL | 265,207 | 77% | 367,947 | 74% | -4% |
| Washington-Arlington-Alexandria, DC-VA-MD-WV | 459,512 | 84% | 683,730 | 82% | -2% |
| U.S. total | 30,835,183 | 78% | 37,356,761 | 73% | -5% |

